# CECEP / 数字环保助力环境监测 - ID: 317 - URL: https://www.stoyard.com/works/317 - English URL: https://www.stoyard.com/en/works/317 - Year: 2021 - Cover: https://static.glabcms.stoyard.com/stoyard/project/cover/20211209/7u54gzn1sj.jpg - Categories: 上市公司, 软件服务, 视频、动态图形、动画设计 - English Categories: Listed Company, Software Services, Motion Graphics - Author: STOYARD - English Author: STOYARD - Publish: 2021-07-14 - Editor: STOYARD BEIJING ## 中文主体 ### 项目简介 我们受中节集团(CECEP)委托为咸宁设计了一套环境质量监测平台,打通监管全流程,实现地区生态环境监管转型升级。 平台涵盖环保工作全流程,将数据分析,监管决策,大数据资讯,公共服务平台整合,并细分为17个子系统。 [Video](https://static.glabcms.stoyard.com/stoyard/gallery/20210714/vp8ljrbdag.mp4) 数字化时代催生了新的生态模式,高频的数据交互驱动业务逐渐向数字化方向迁移。无论是物质生产者还是文化输出者无一例外都要适应变化以求满足消费者的精细需求,许多大型企业也在这种时代变革下进入转型。 CECEP是唯一 一家主业为节能减排、环境保护的央企。随着数字化时代到来,CECEP作为经历多次优化变革的大型企业,以“聚合点滴,创生无限”为经营理念,力图打造节能环保的“全产业链”。 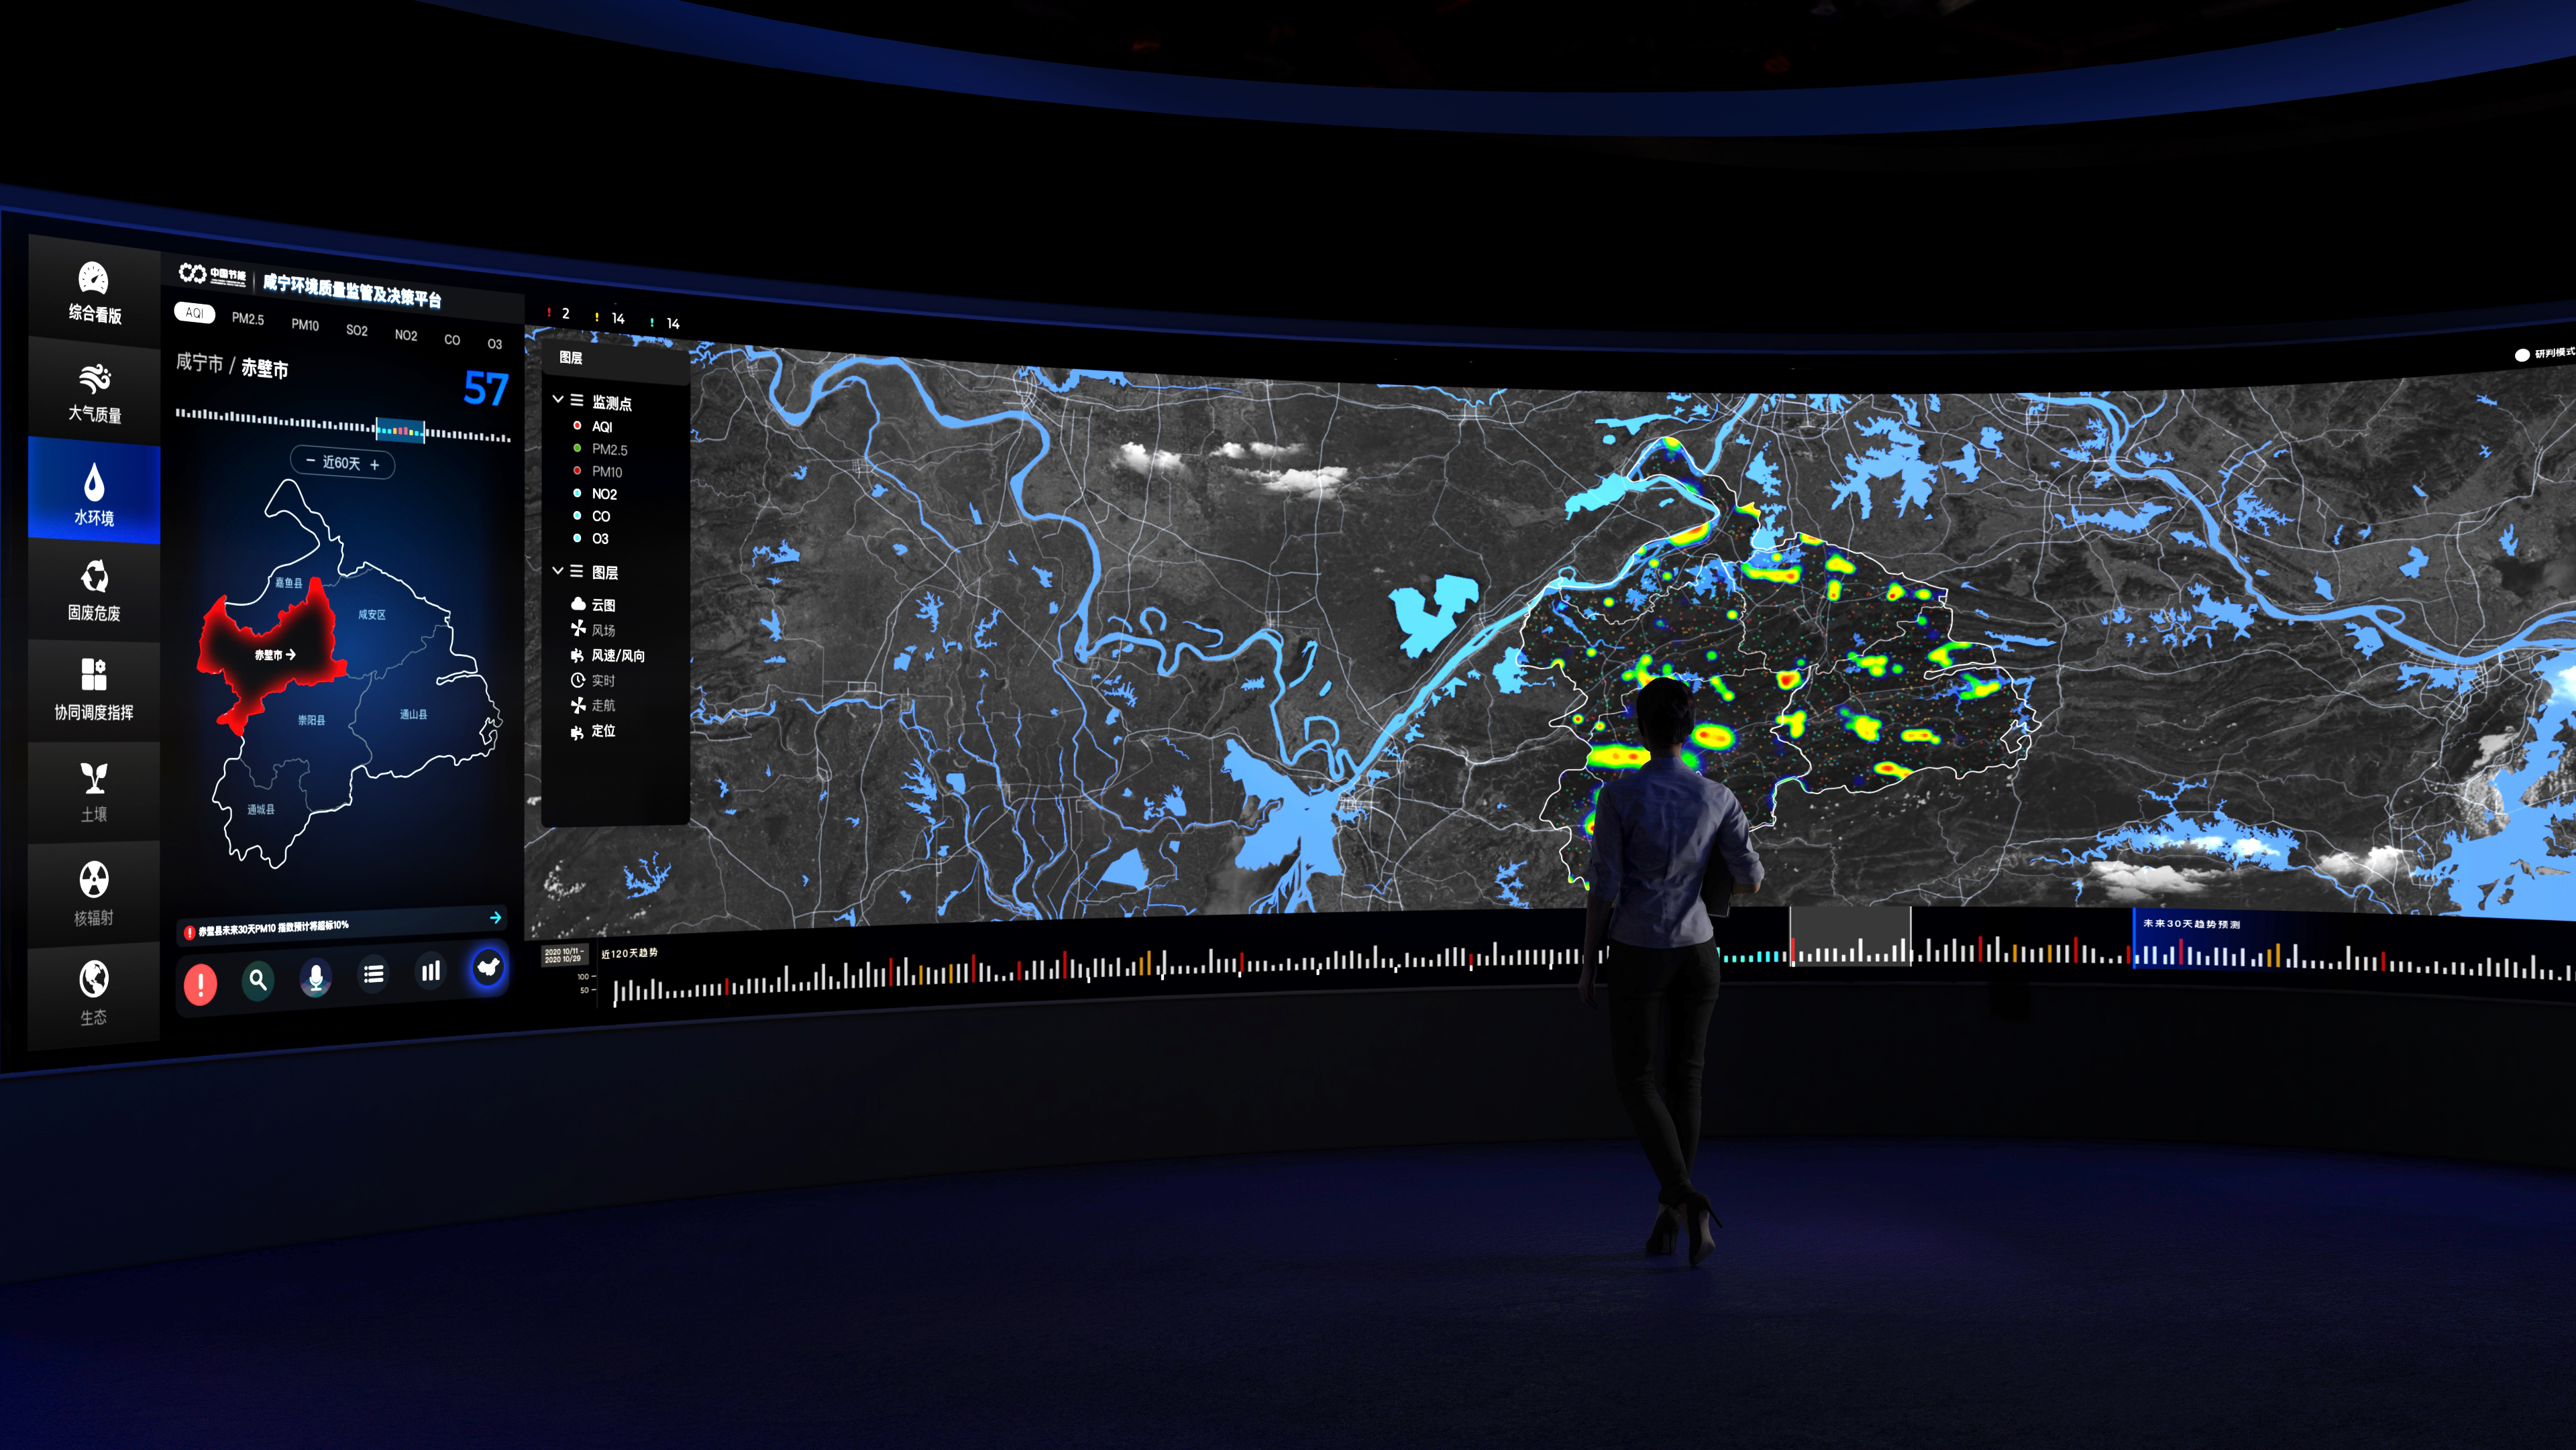 2021年,STOYARD与CECEP达成合作,为咸宁地区打造环境质量监测平台。 咸宁环境质量监测平台系统打通监管全流程,实现地区生态环境监管转型升级。平台涵盖环保工作全流程,将数据分析,监管决策,大数据资讯,公共服务平台整合,并细分为17个子系统。 此次项目,我们希望通过对大数据的设计, 最终实现企业对环境的“ 科学、 严格 、 精致、 长效 ”管理,使繁复的数据变成像、 图 、 文三位一体的视觉体系。 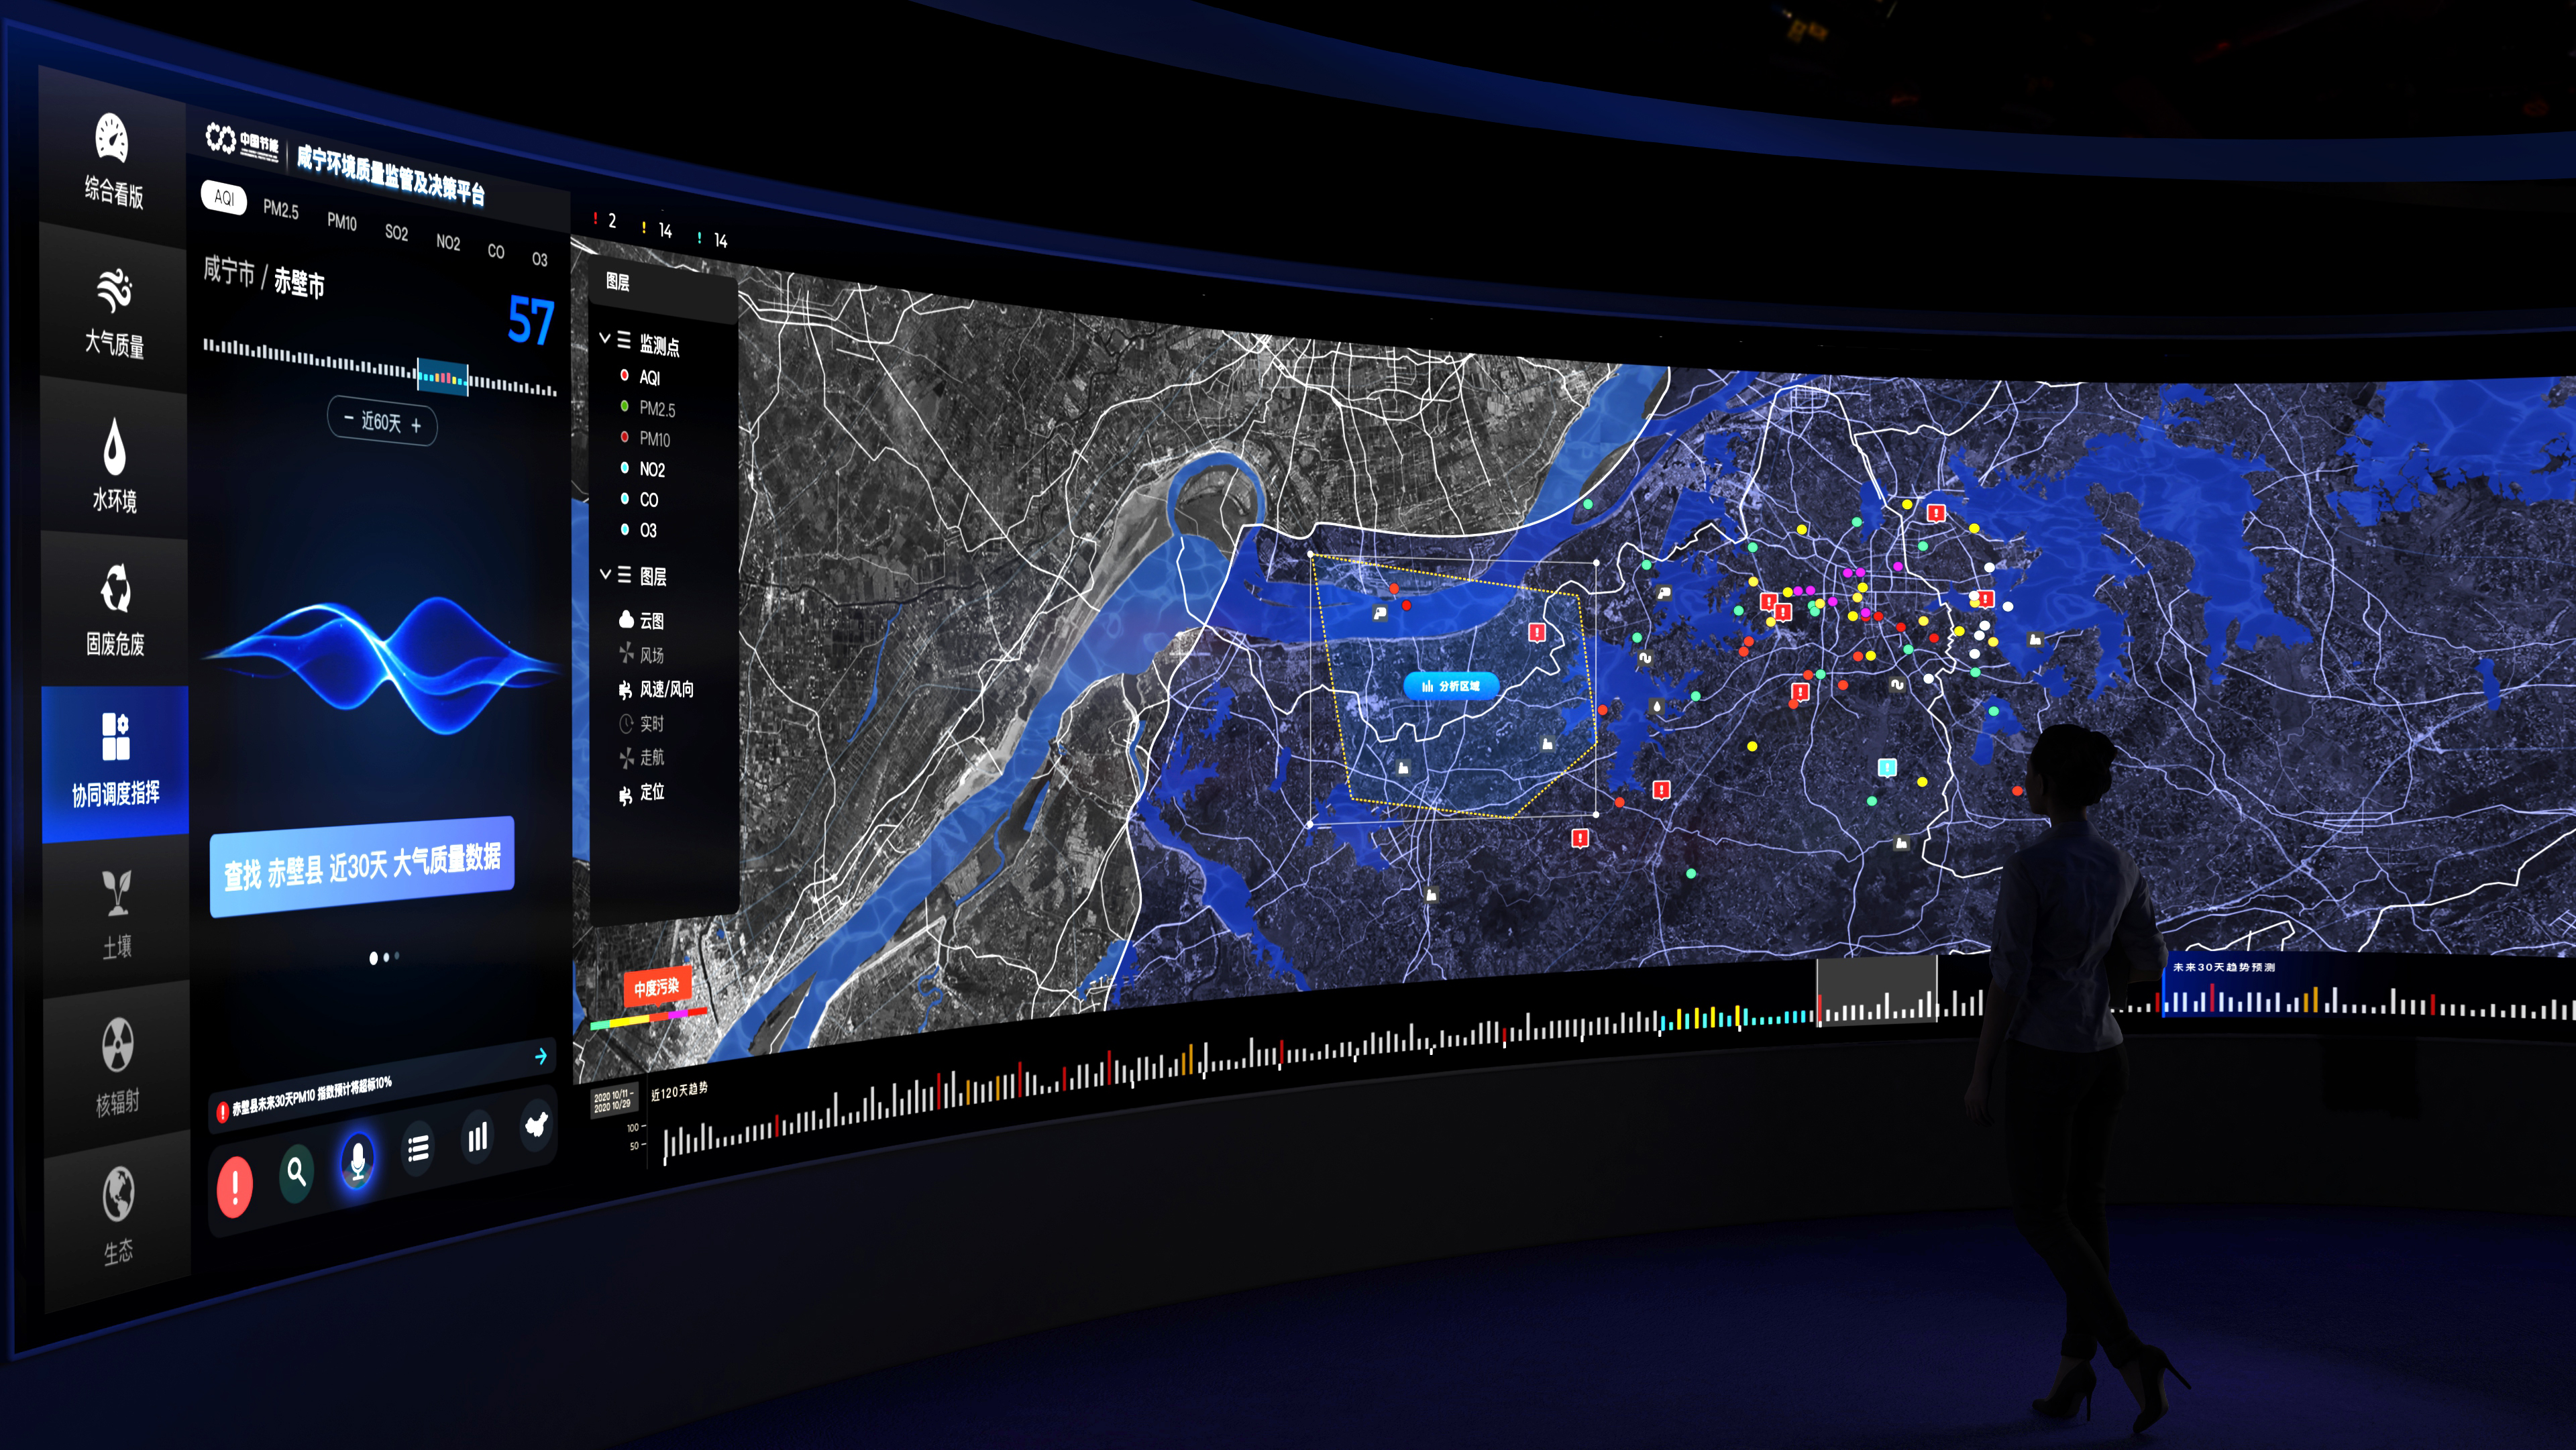 咸宁水环境综合治理的多平台智慧管控系统,是以环境监测数据的快速响应、业务数据的统一协调、高效的分析处理为首要目标。所以如何高效、准确、清晰地整合如此庞大的“信息体积”,是STOYARD团队承接这一项目后要攻克的第一道难关。 我们在设计前通过调研,从客户需求提取了一部分关键字用以规范设计方向。“无限、智能、科技、未来 ”这些词明确了我们的设计要以这些点为圆心加以扩散。 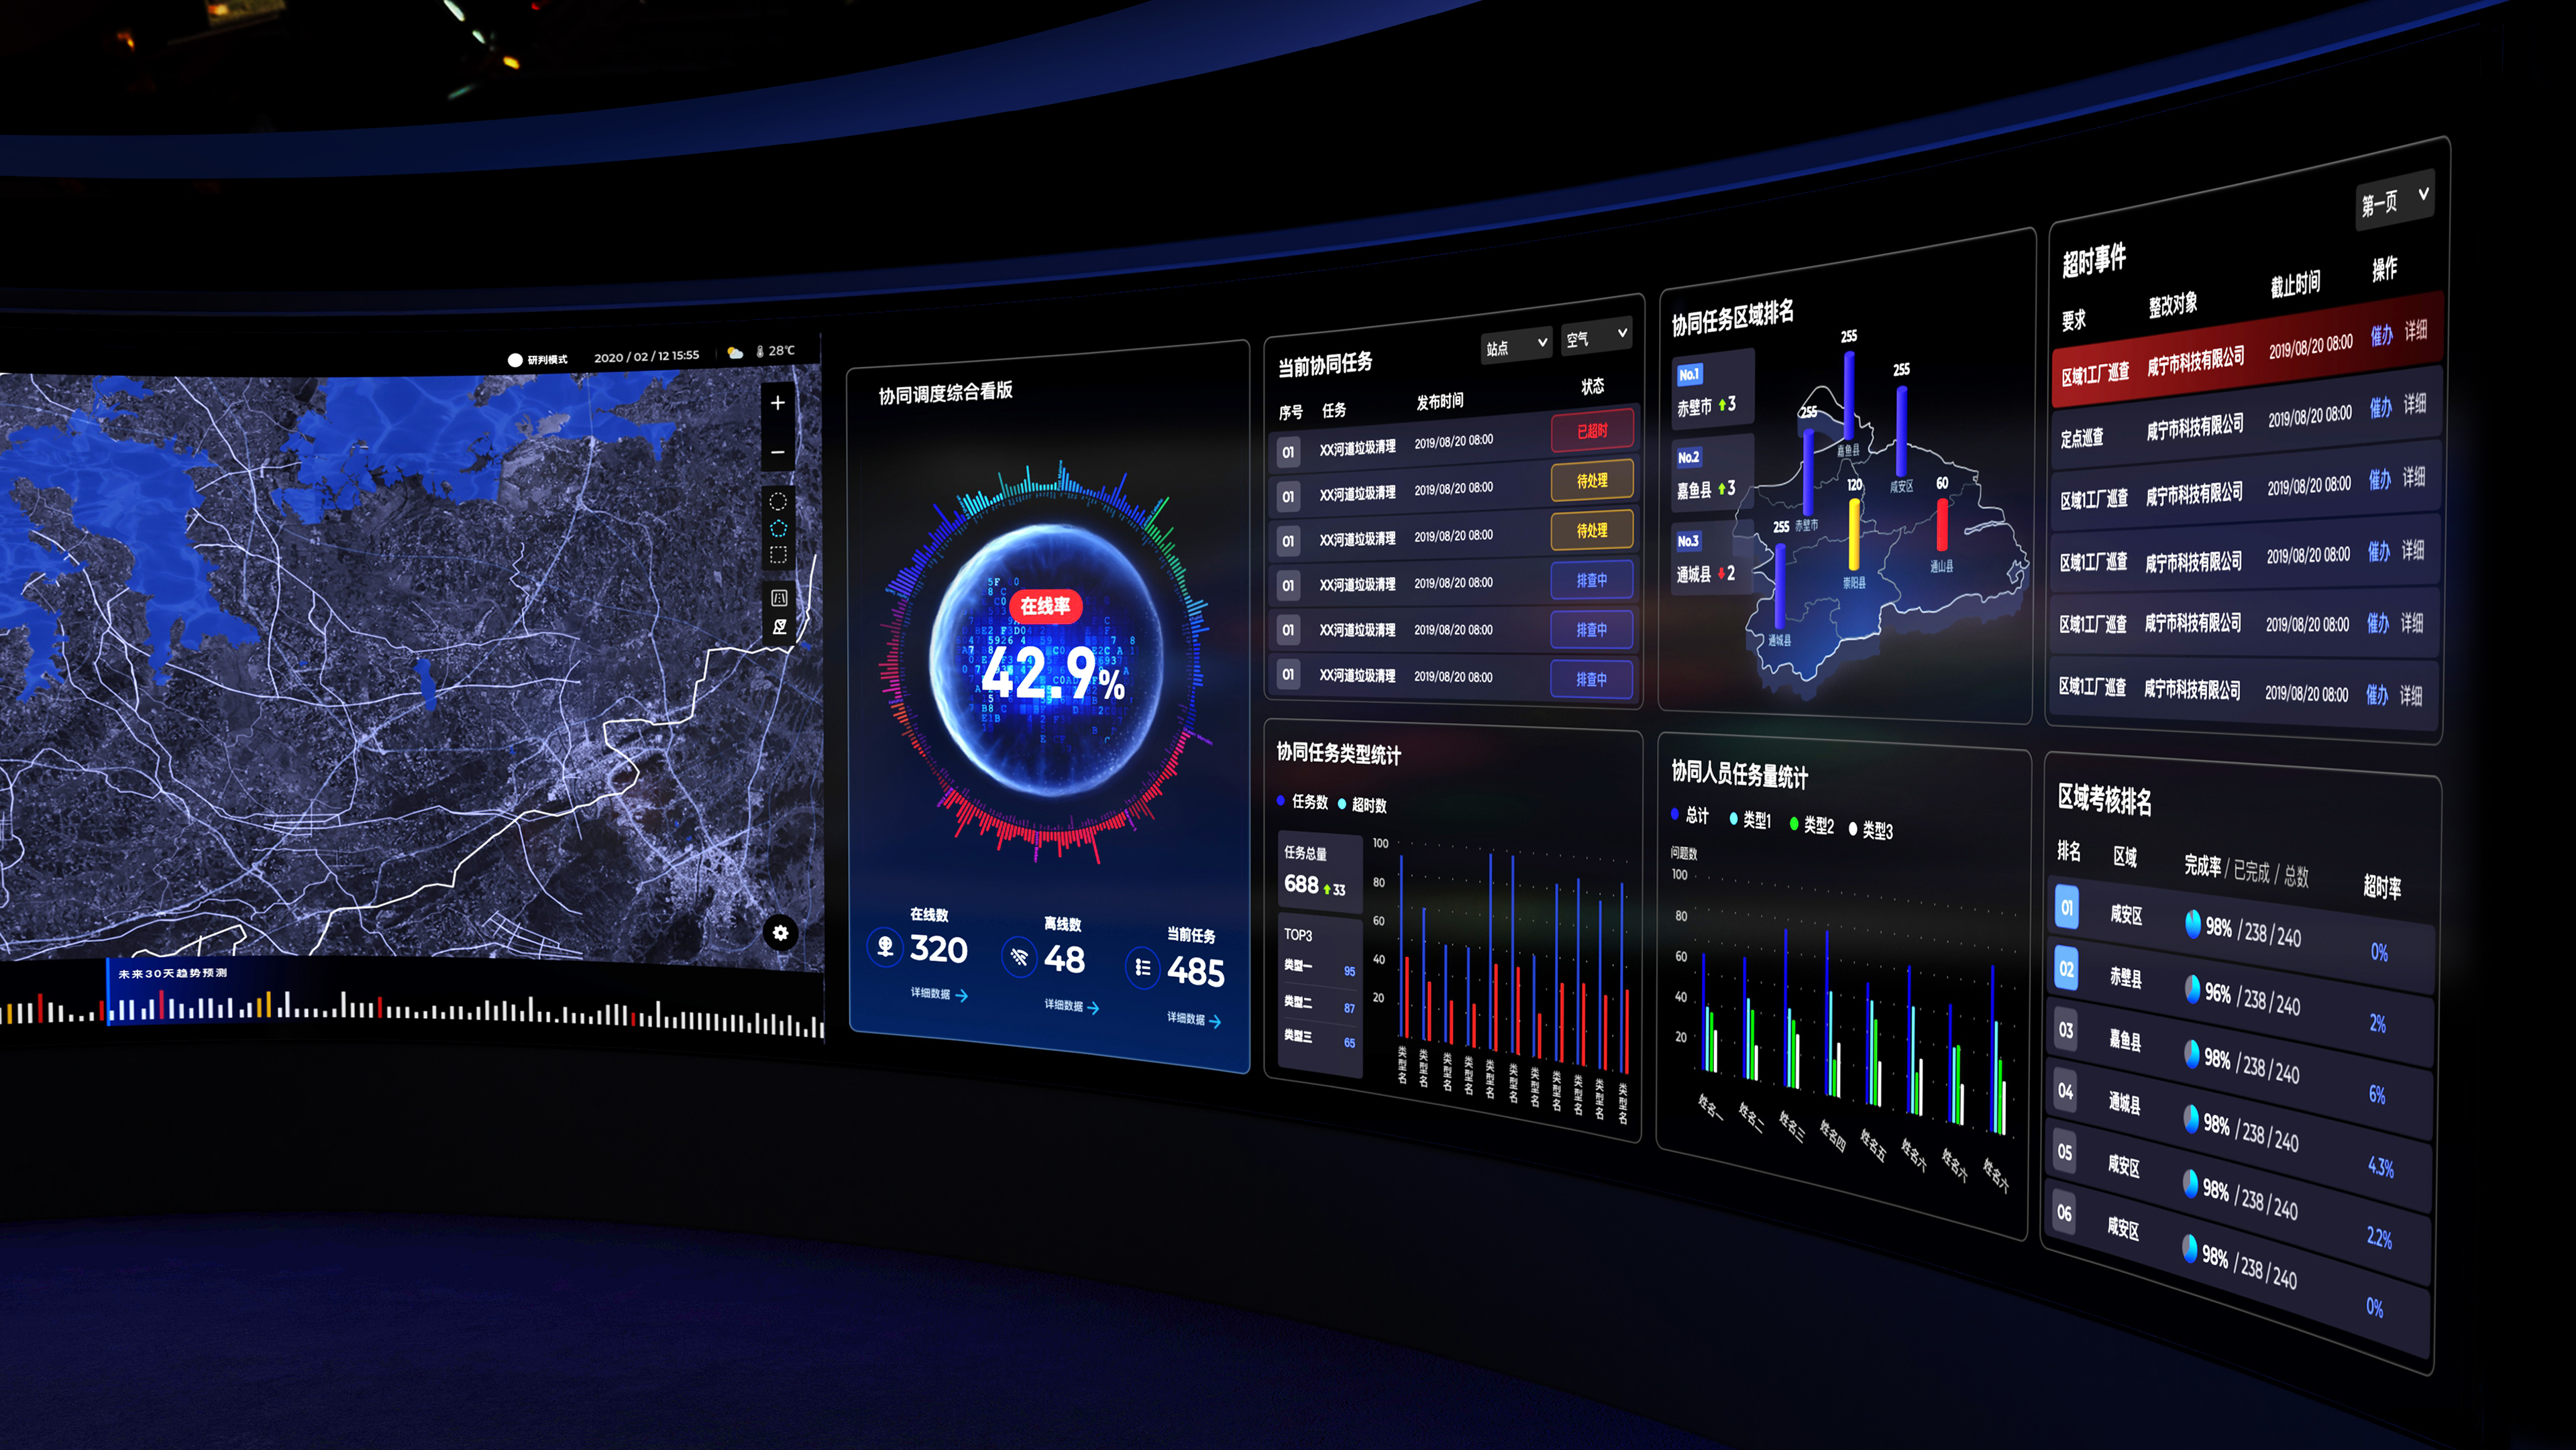 数据的变化趋势更直观数据信息通过柱状图、折线图等图形数字结合的方式在大屏展现,信息的变化更加一目了然,方便用户实时查看当前信息以及信息之间的对比。 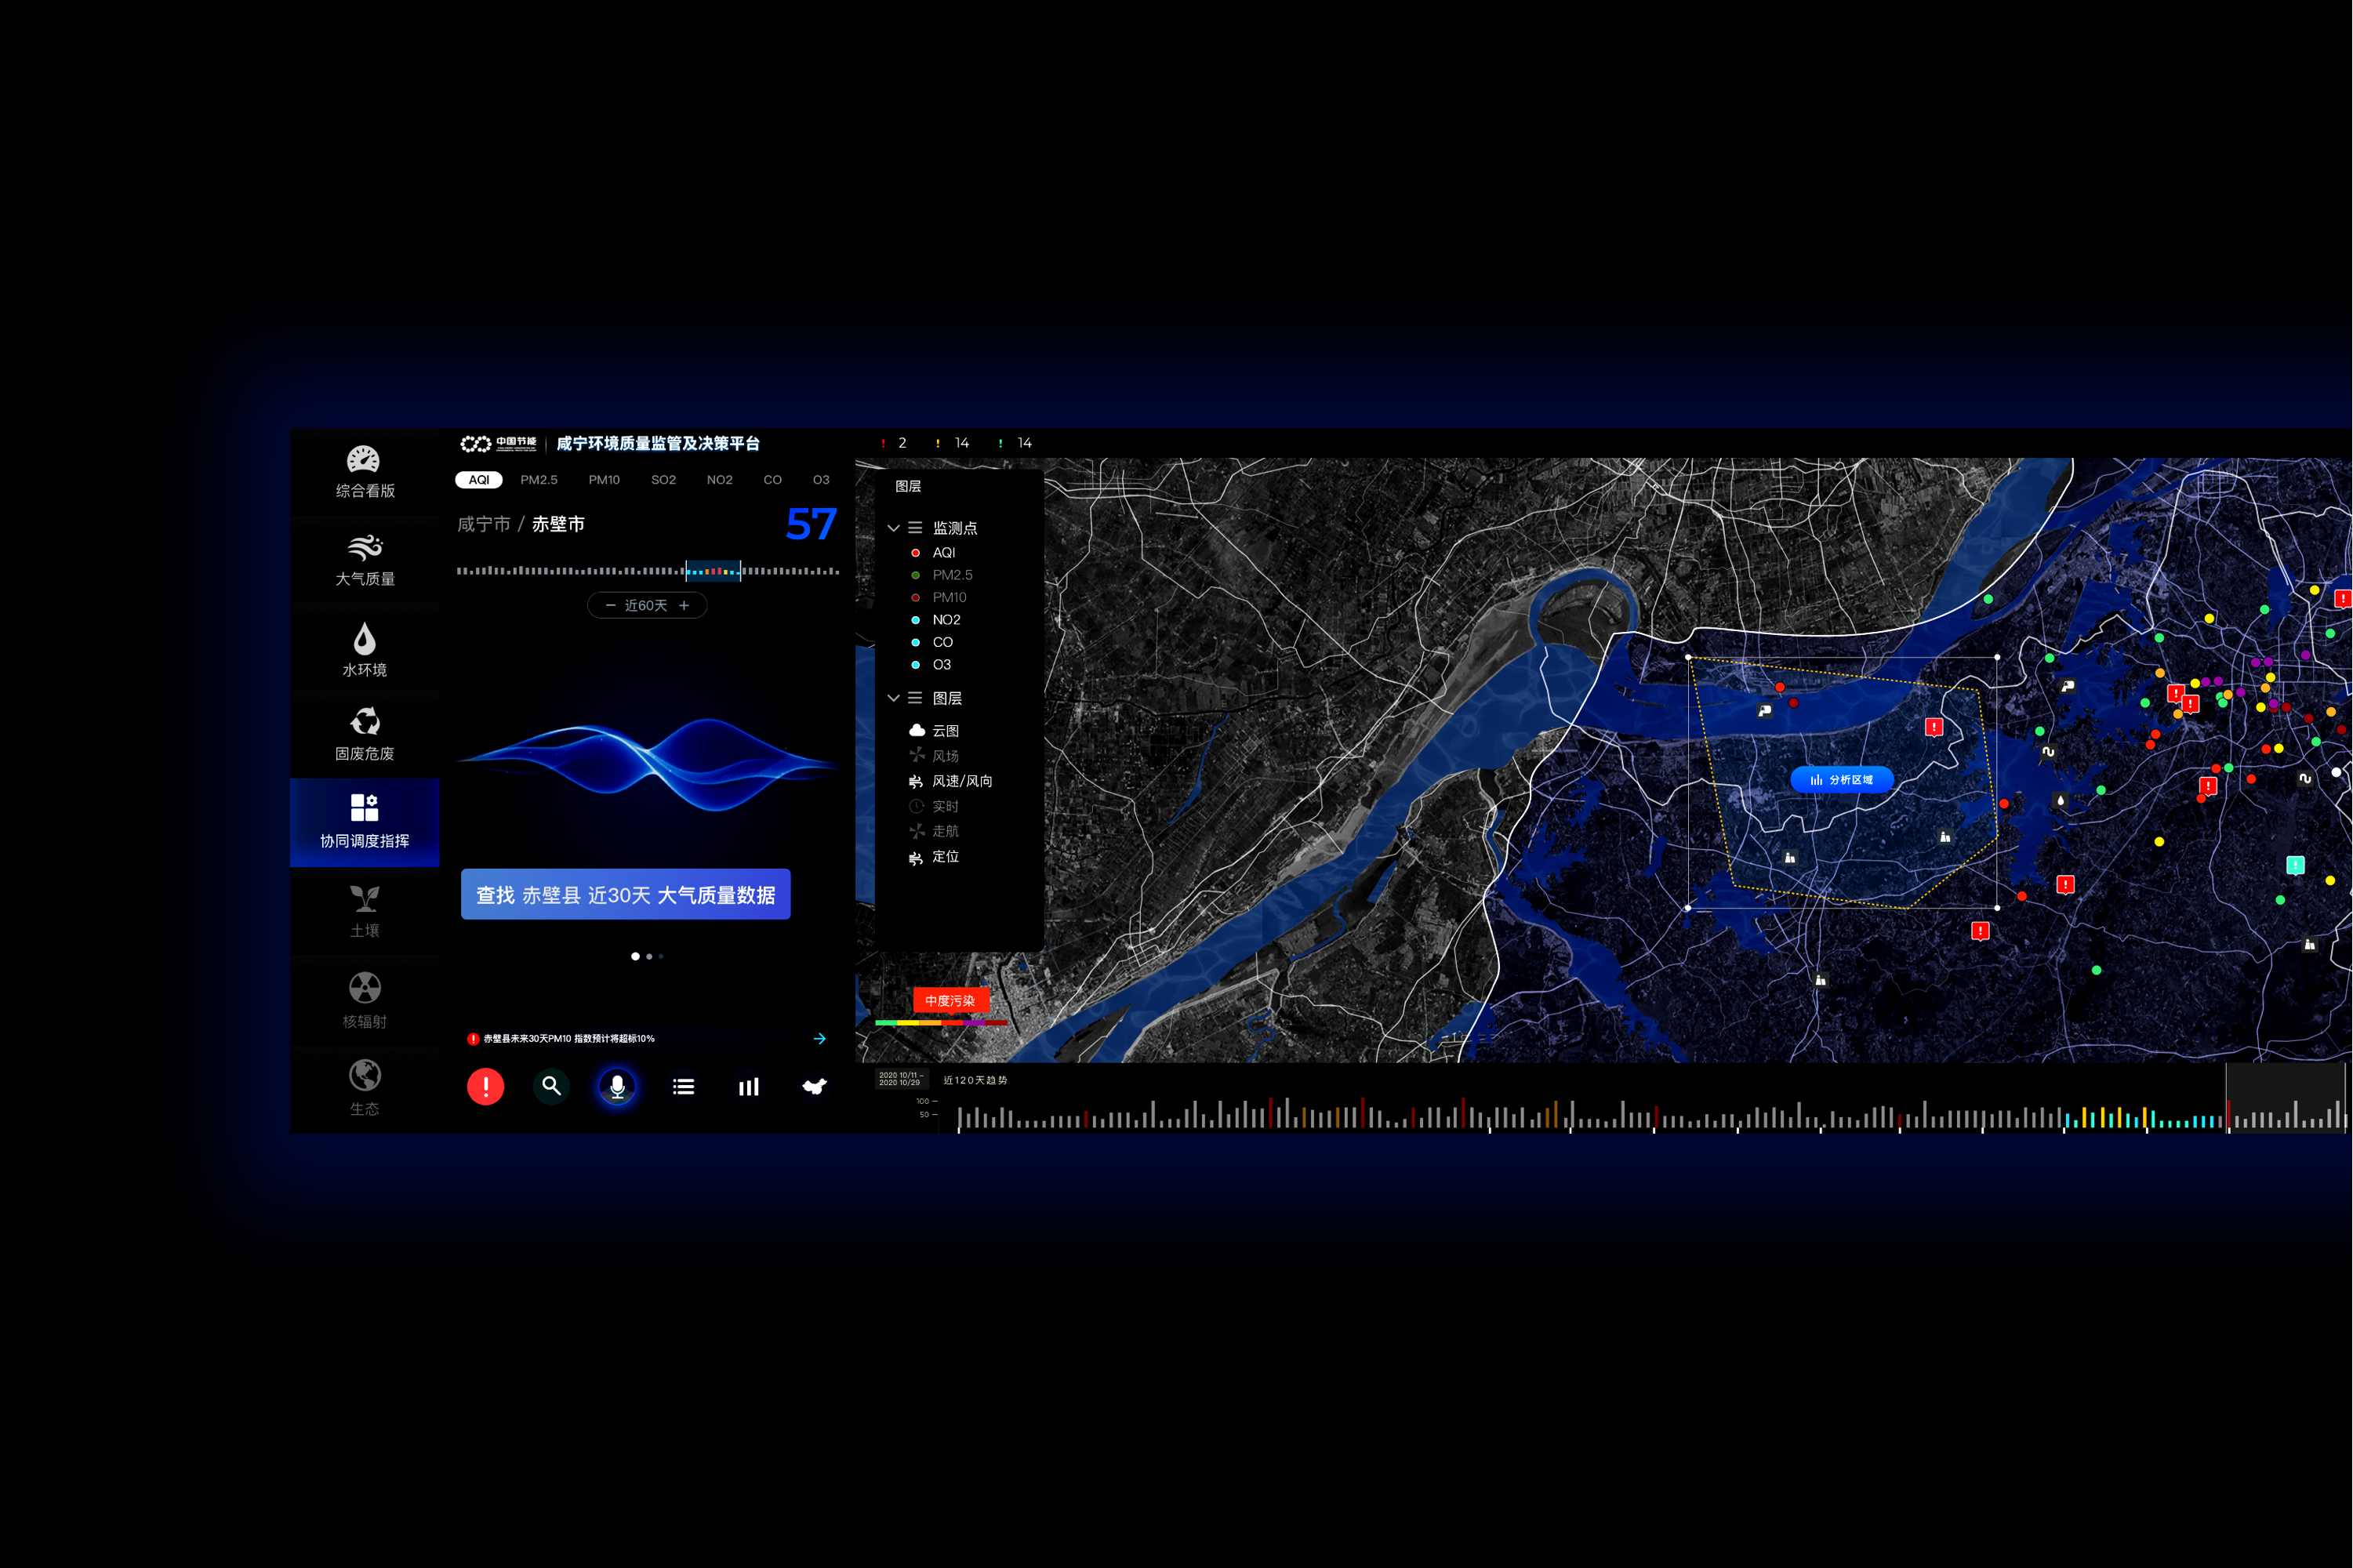 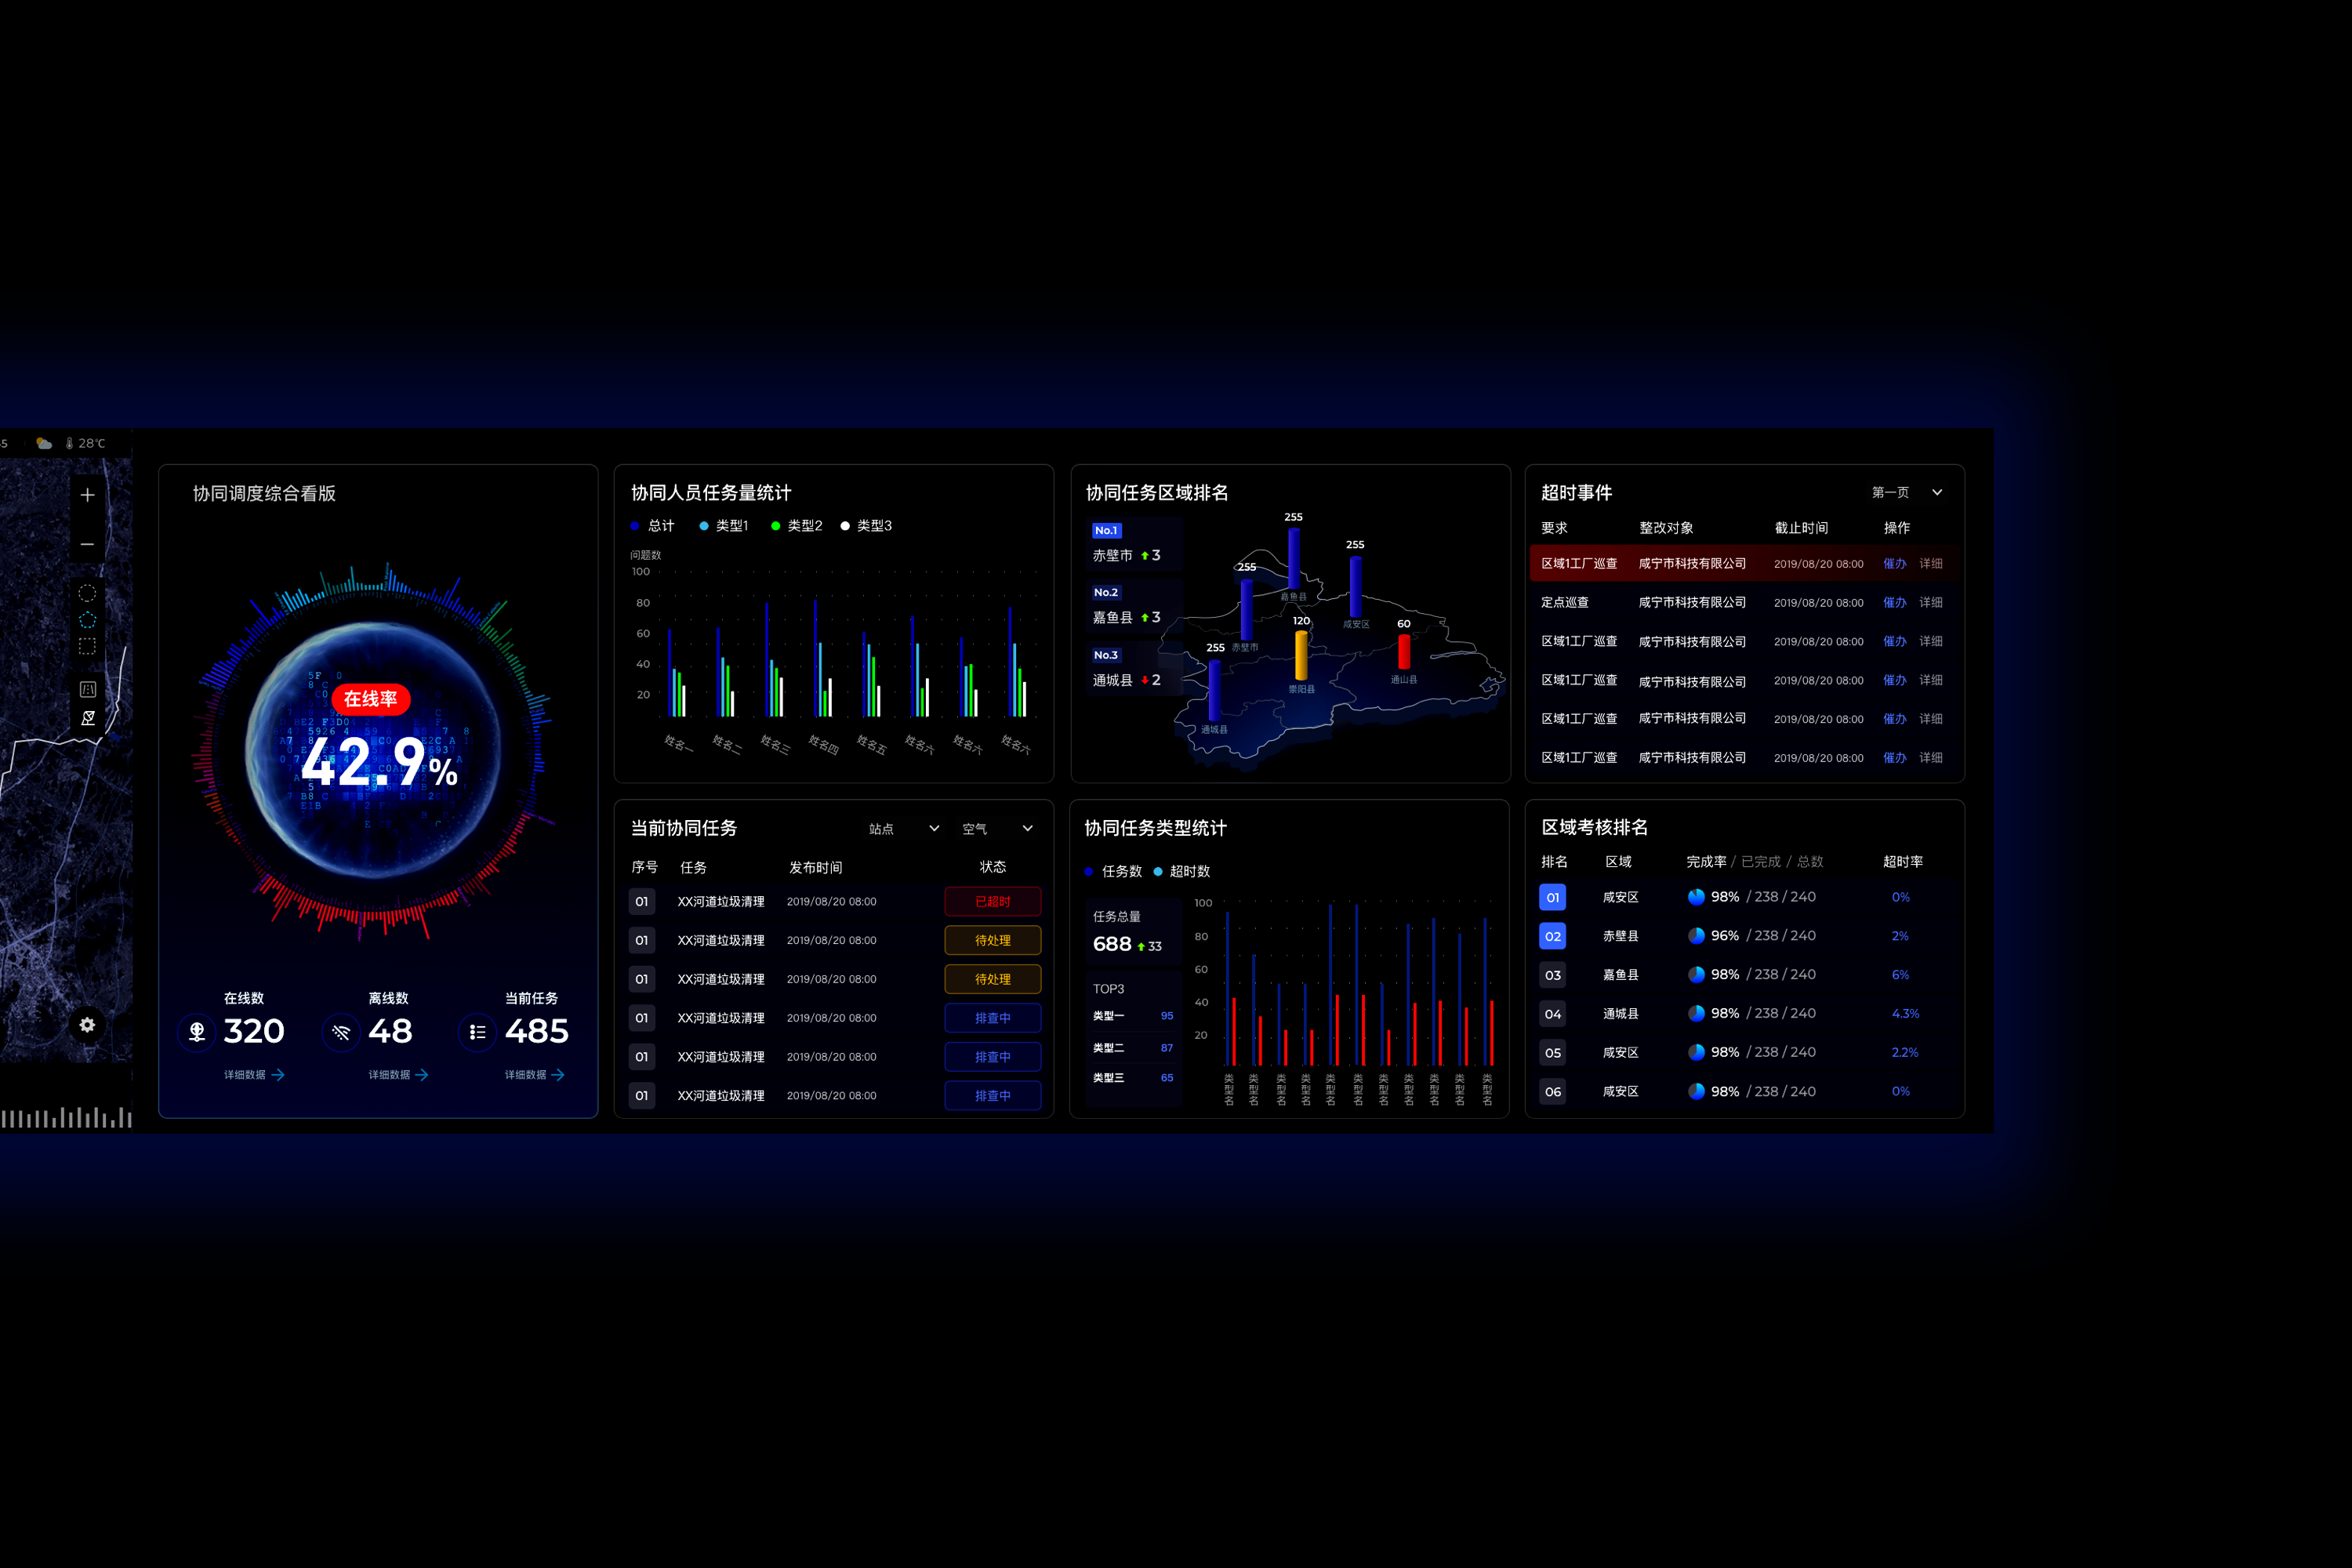 我们进行数据可视化界面的设计过程中,难点就在于如何将复杂且繁多的信息布局排版,以及结合图表使信息呈现得更加简洁直观,既要功能强大又要美观。 整套系统成为—个拥有高亮度、高清晰度、高智能化控制、操作方法先进的大屏幕显示系统。 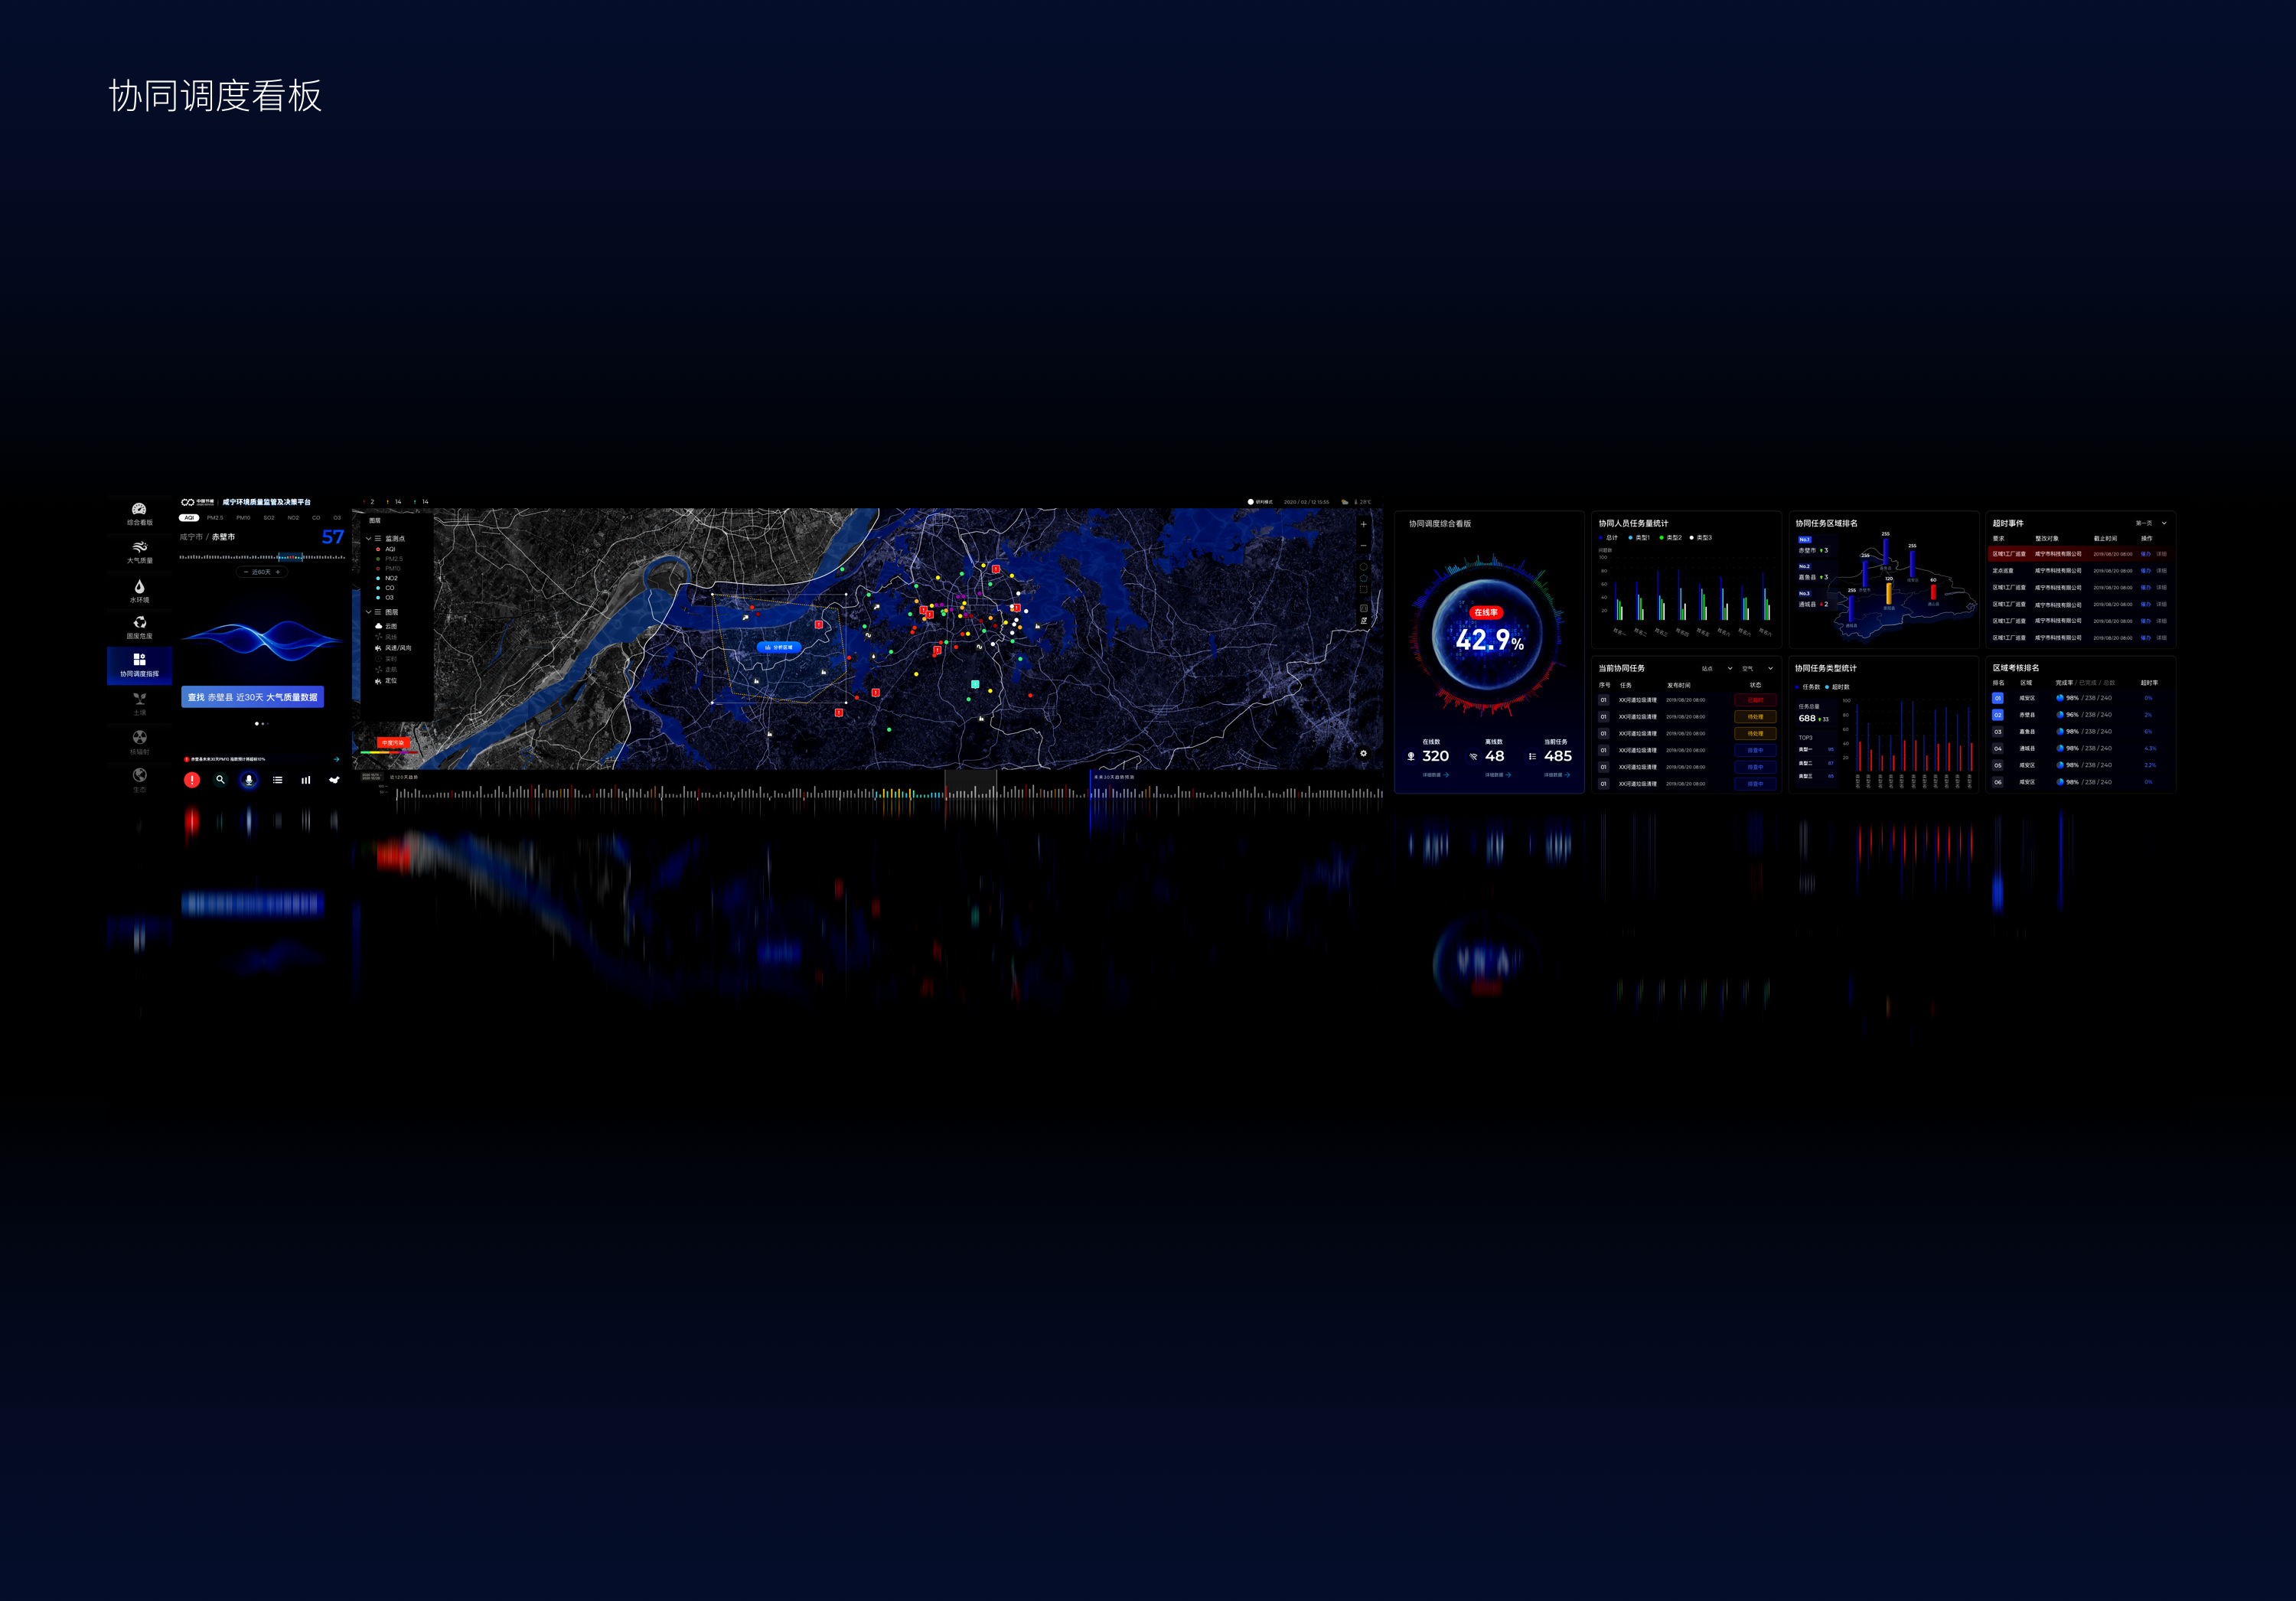 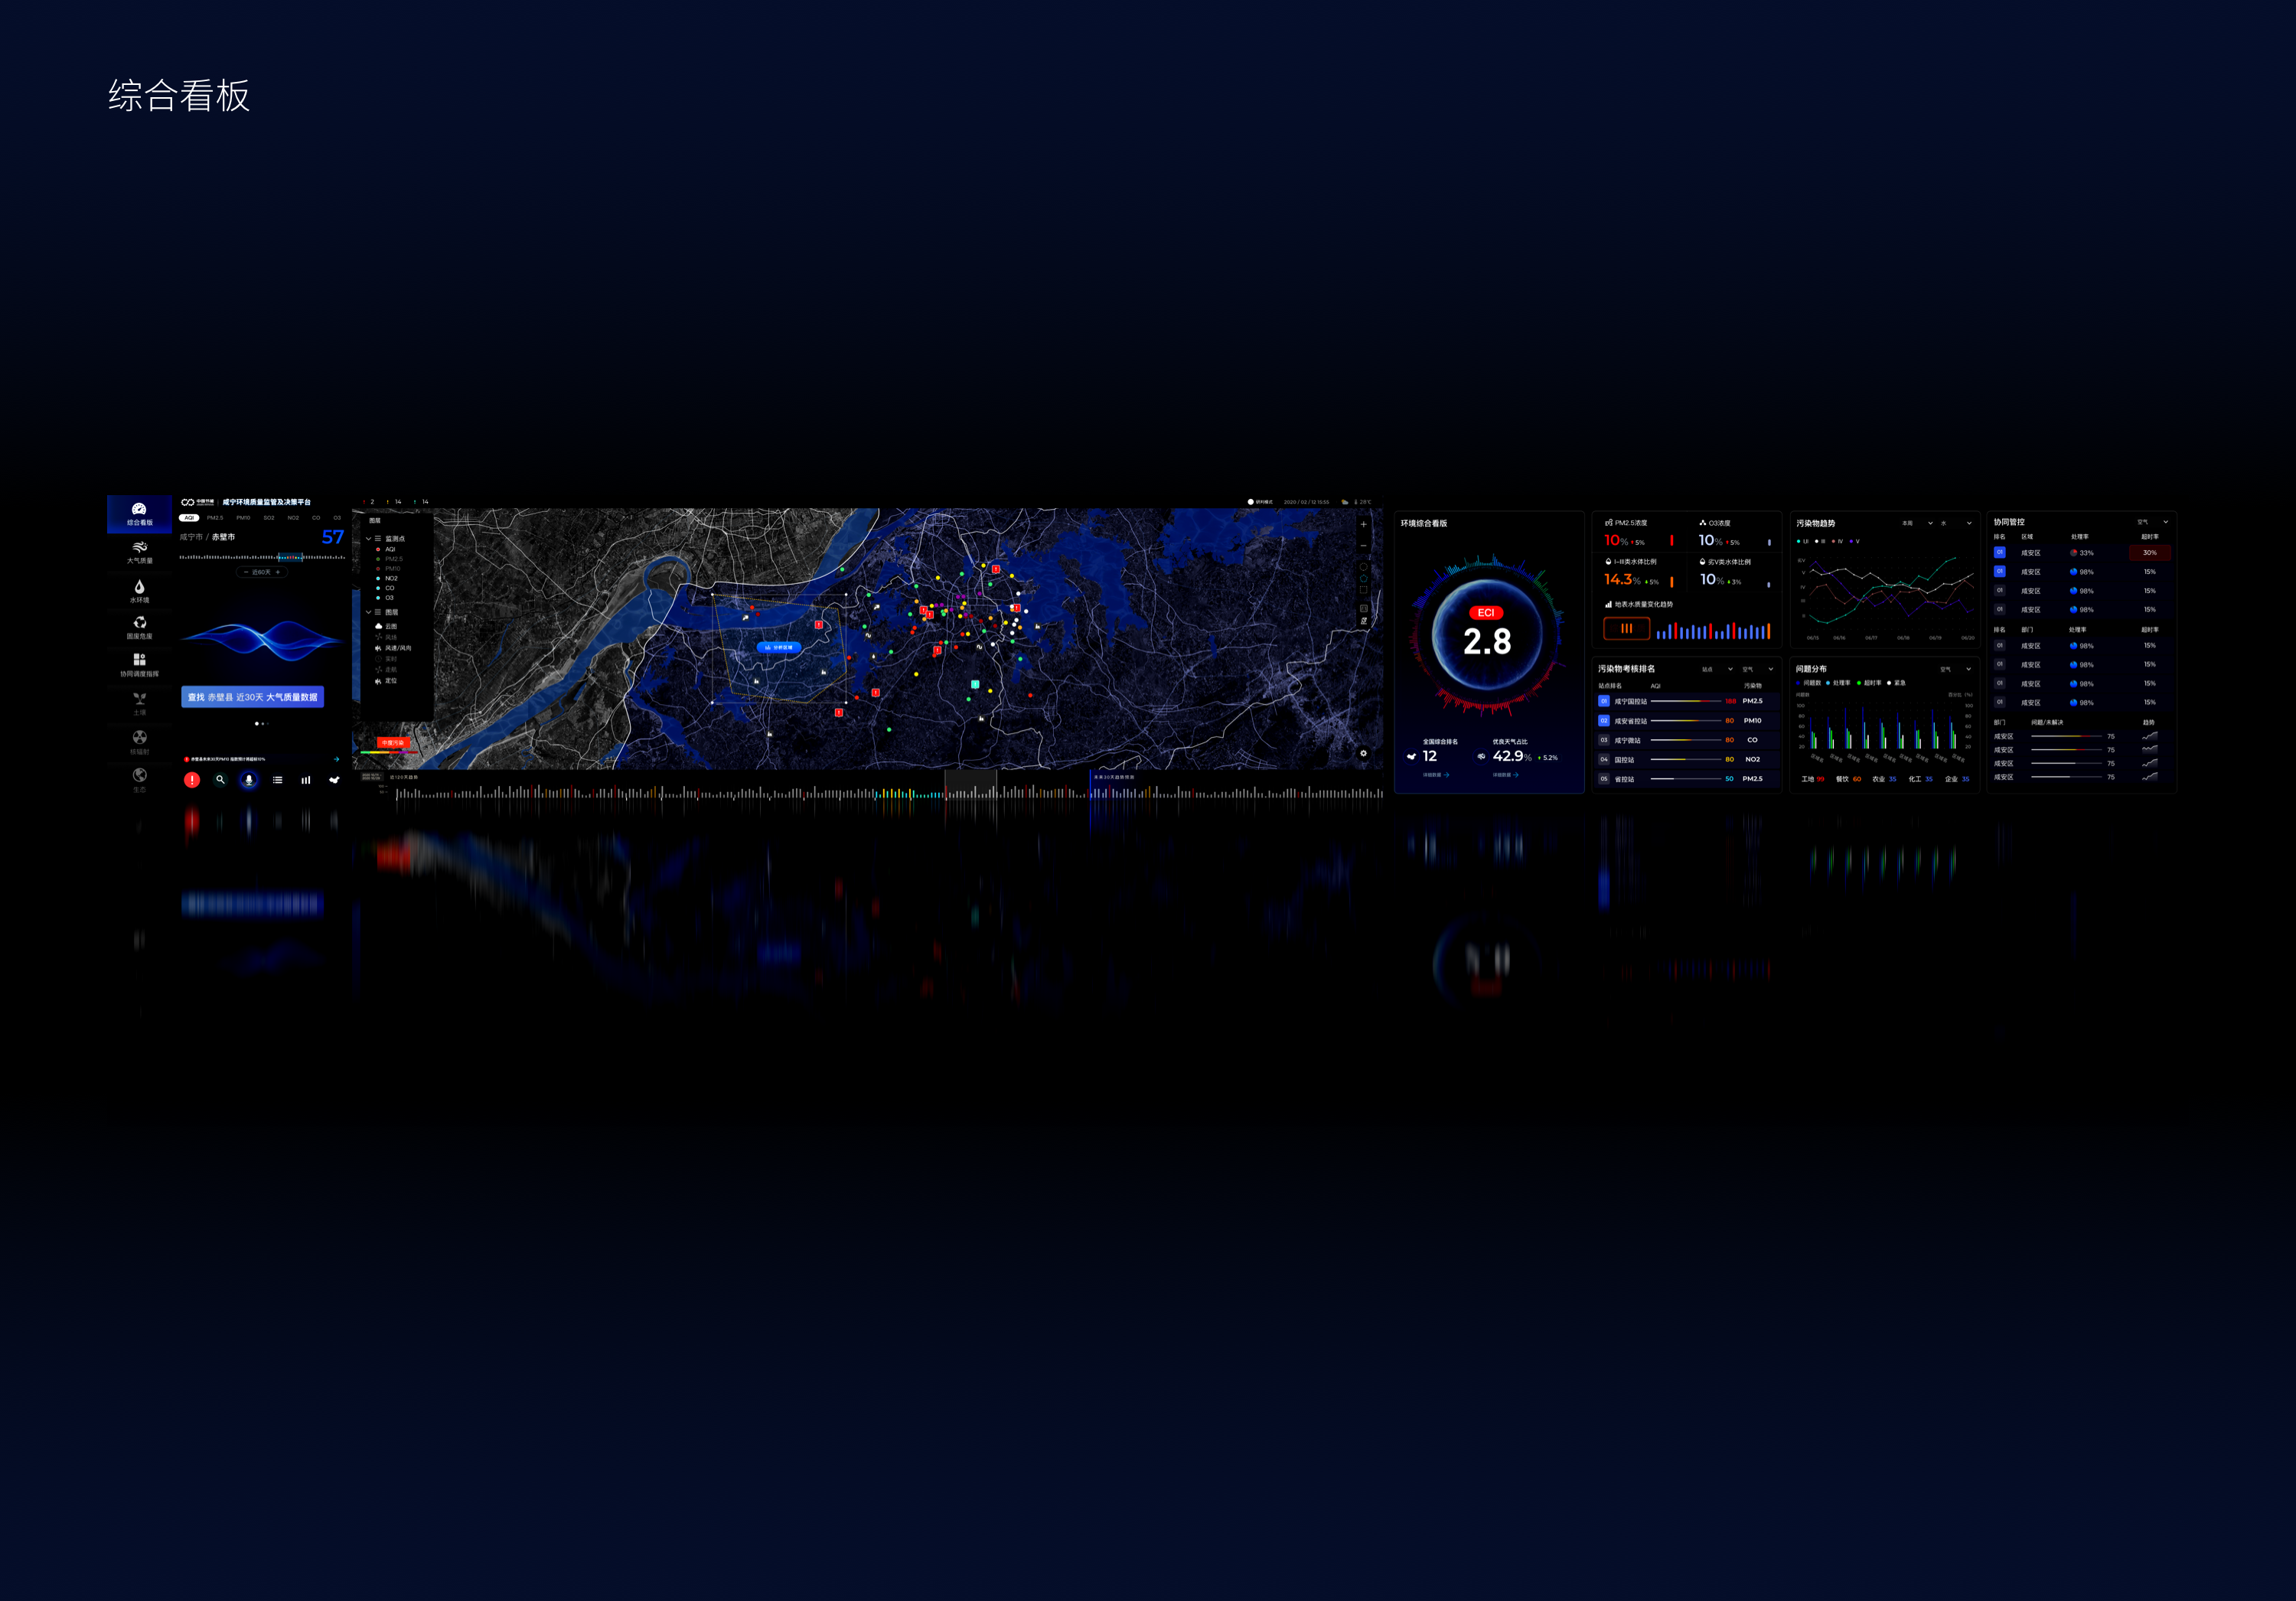 在视觉设计上我们通过定制图标、表格,梳理文本区域的位置来提升框架逻辑,达到各元素的平衡。用户可以轻而易举找某些内容,并快速理解数据内涵。 整体的设计方案务必要保证界面的美观的同时使其在功能上与体验上都达到了最优化。 [Video](https://static.glabcms.stoyard.com/stoyard/gallery/20210715/558epeo98dq.mp4) 我们通过设计带来富有个性化、层次感、空间感的大屏。色彩的运用更方便突出不同含义的重要数据内容,给办公带来一份不同于数据的舒适感。 我们希望让好的内容以美观、流畅、直观的方式呈现;将内容合理布局,使其最终呈现逻辑清晰、视觉醒目的效果,能匹配伟大集团的理念与地位。 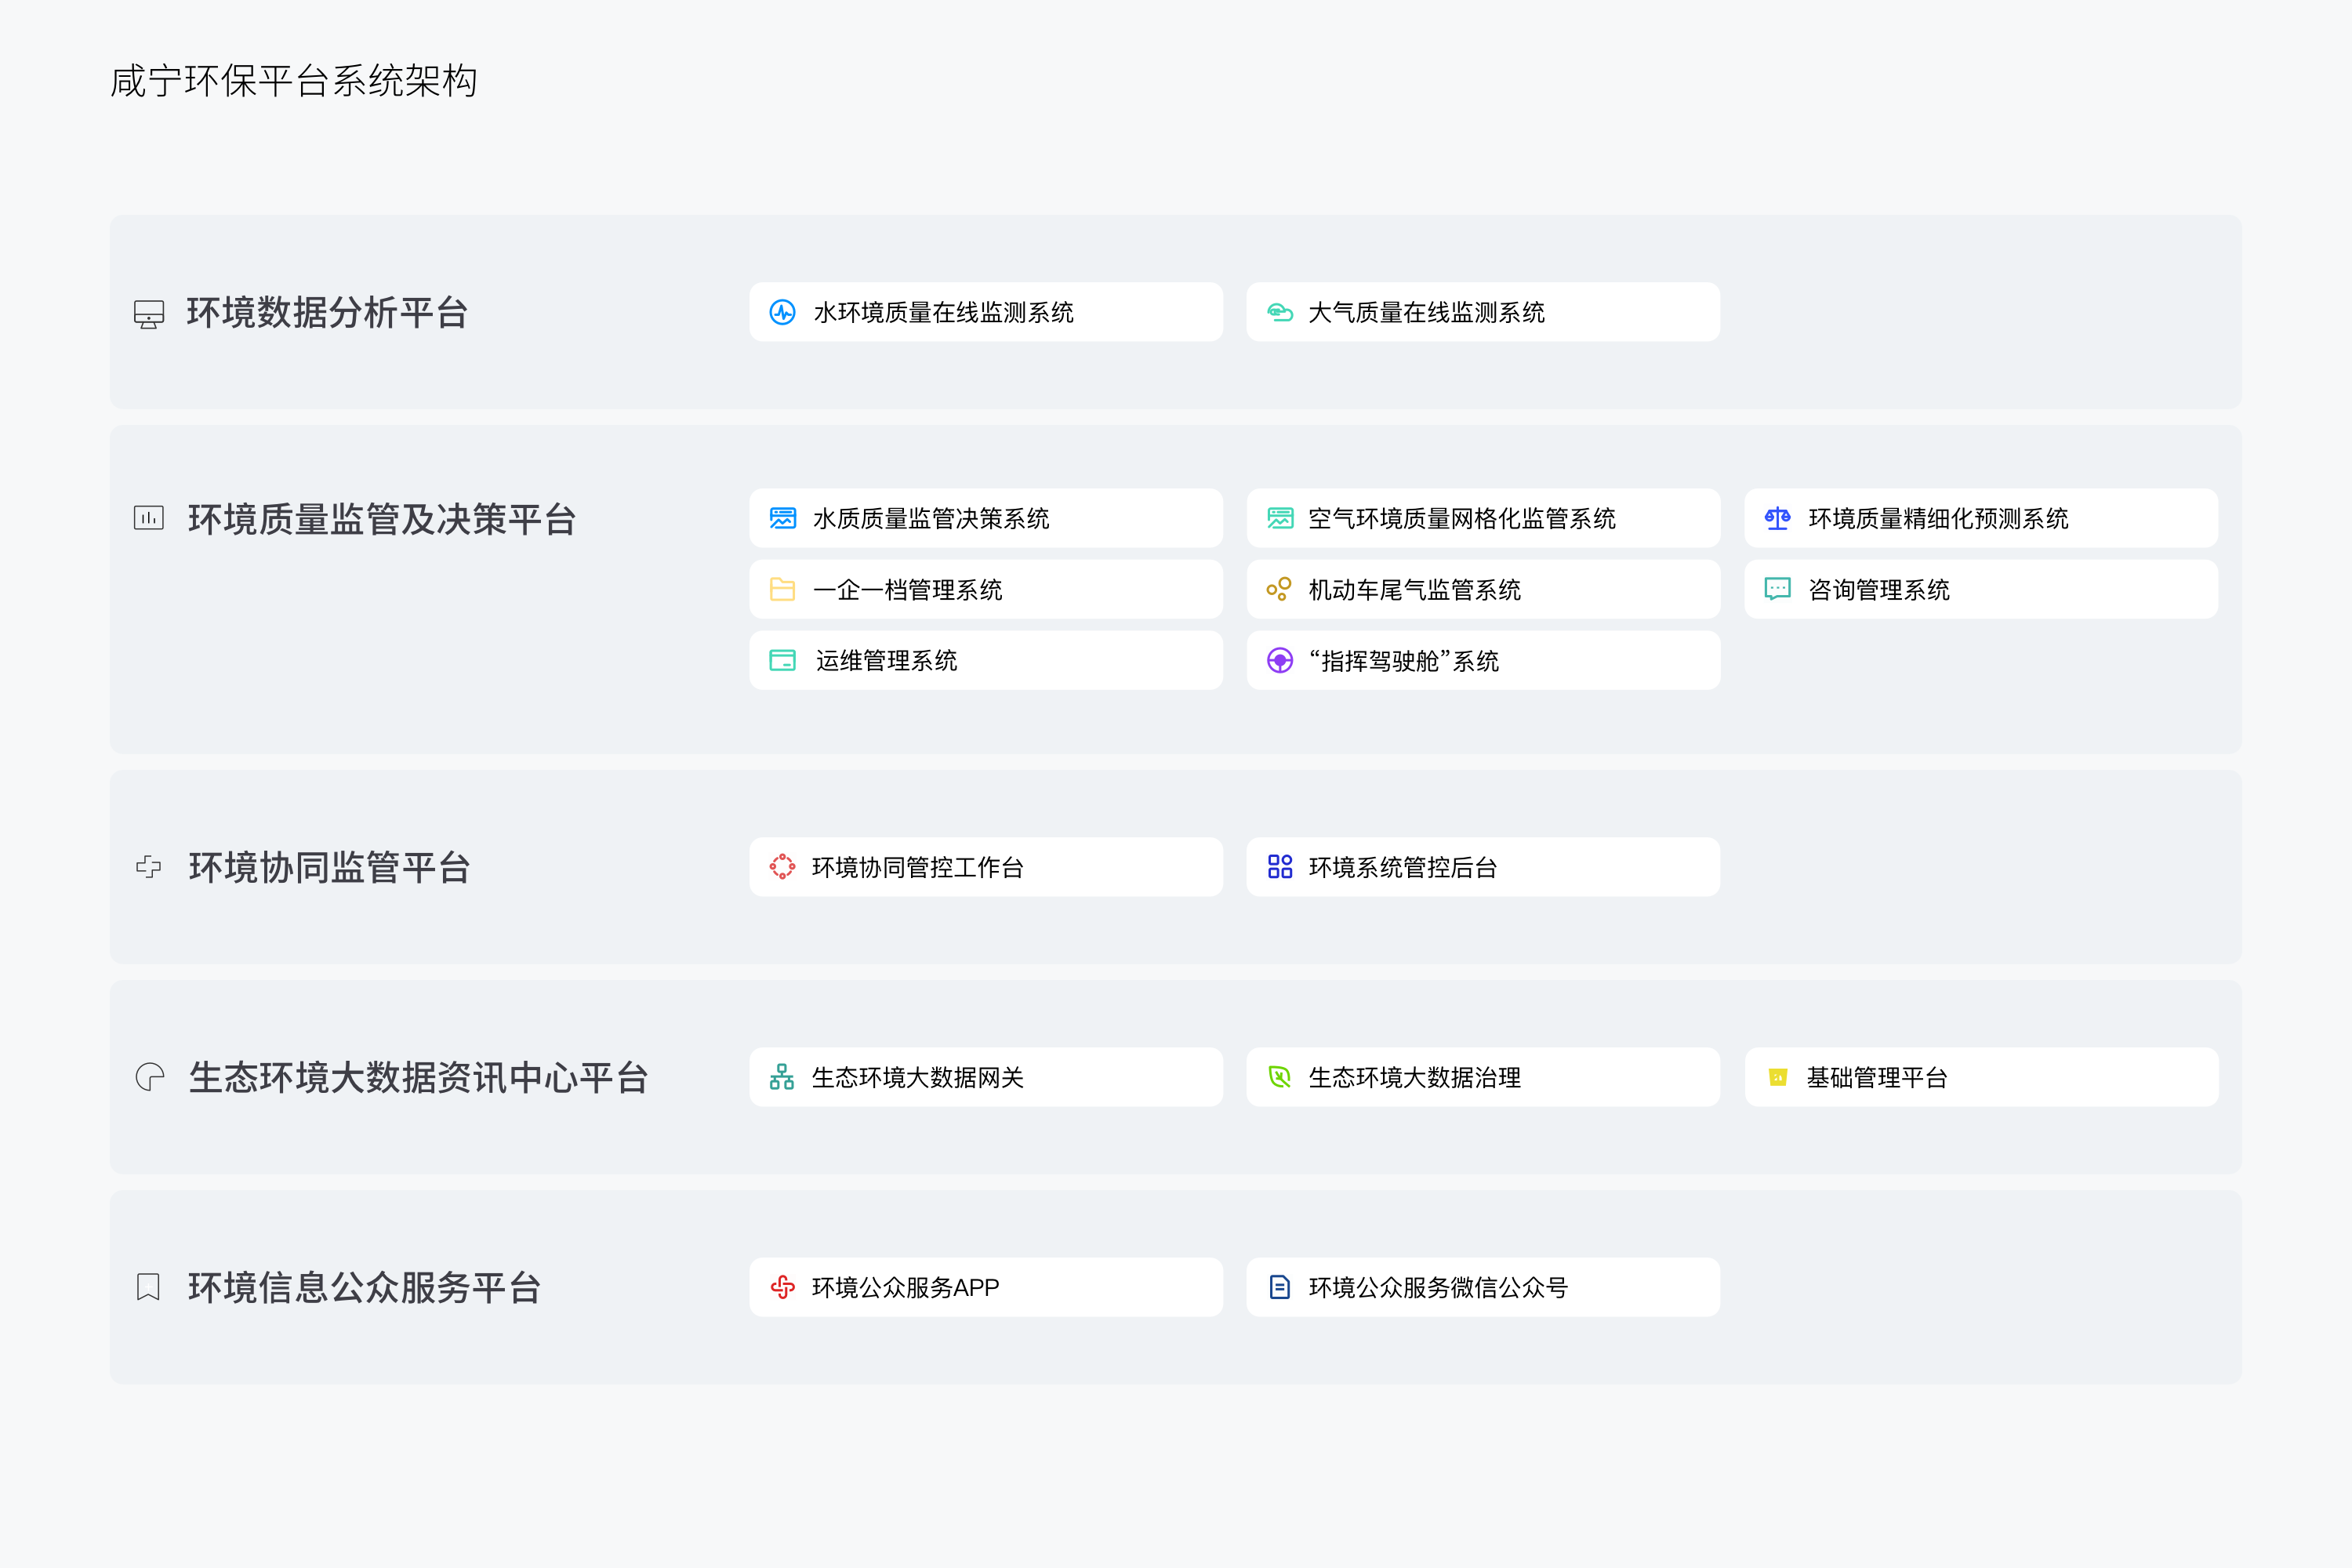 按照“数字环保”的理念和框架,我们采用统一的数据模型和数据标准,建立多源、多时态、多尺度的环境应急与综合管理决策信息平台,实现了多领域的信息交换与共享。 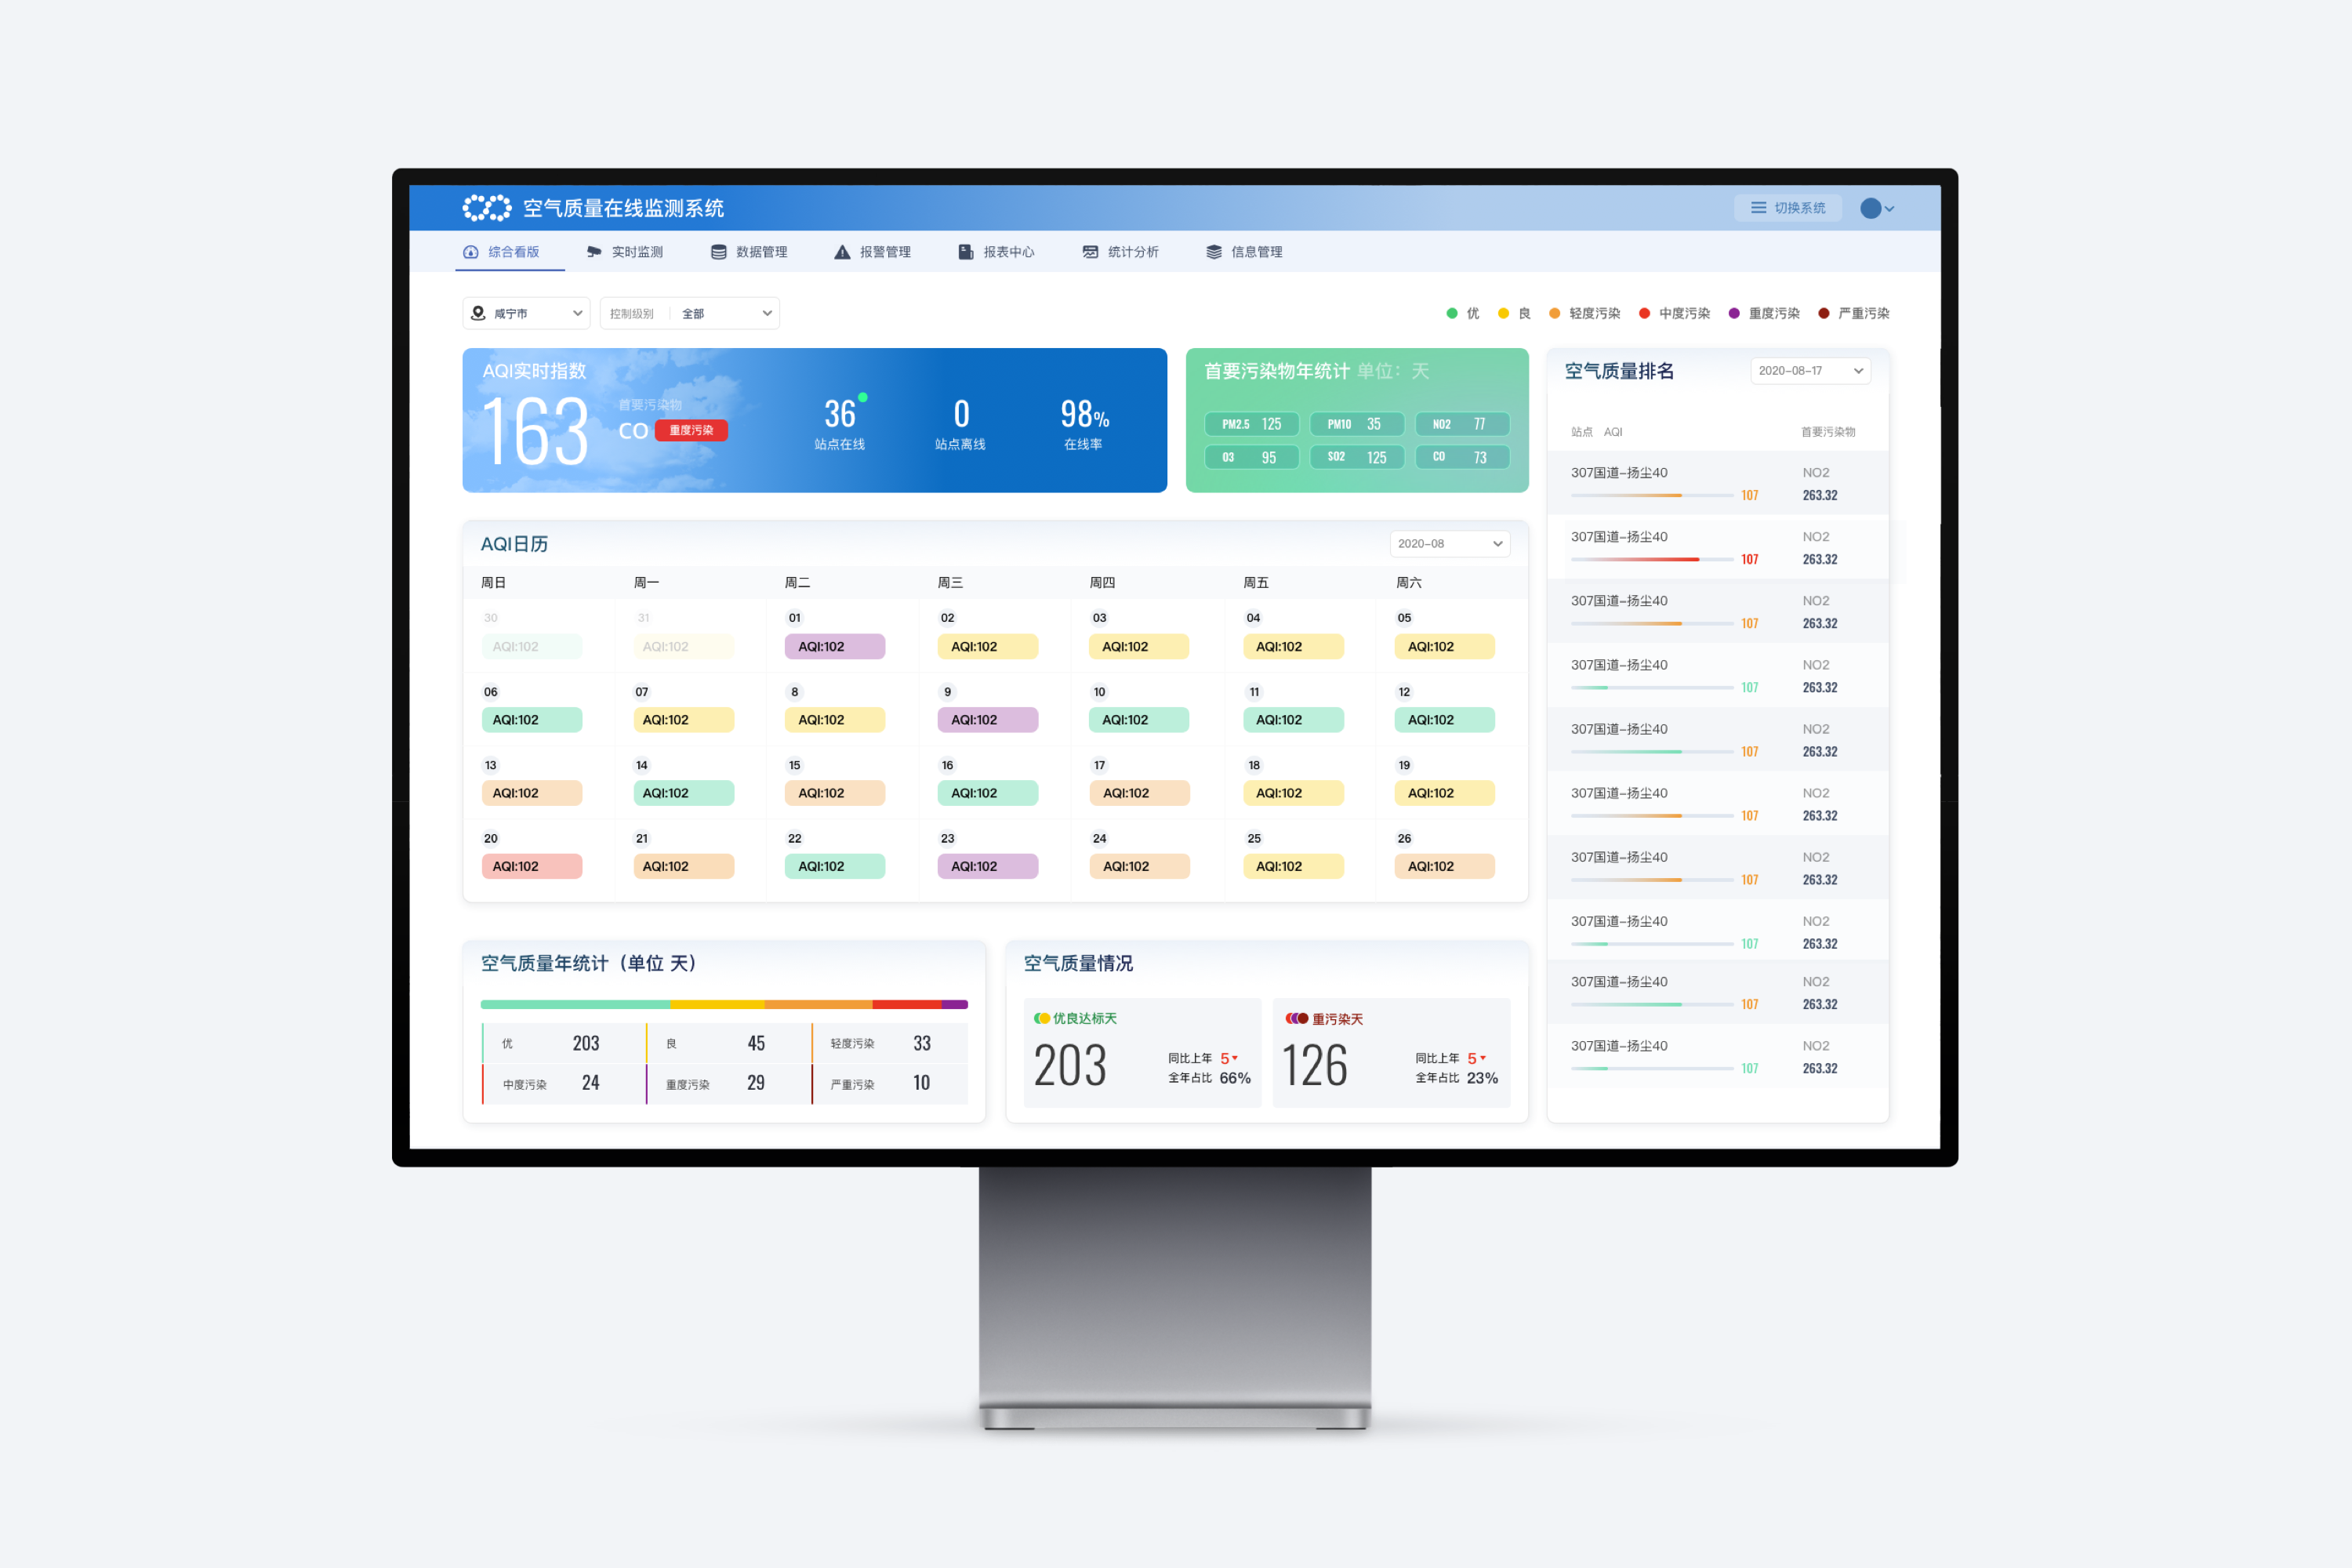 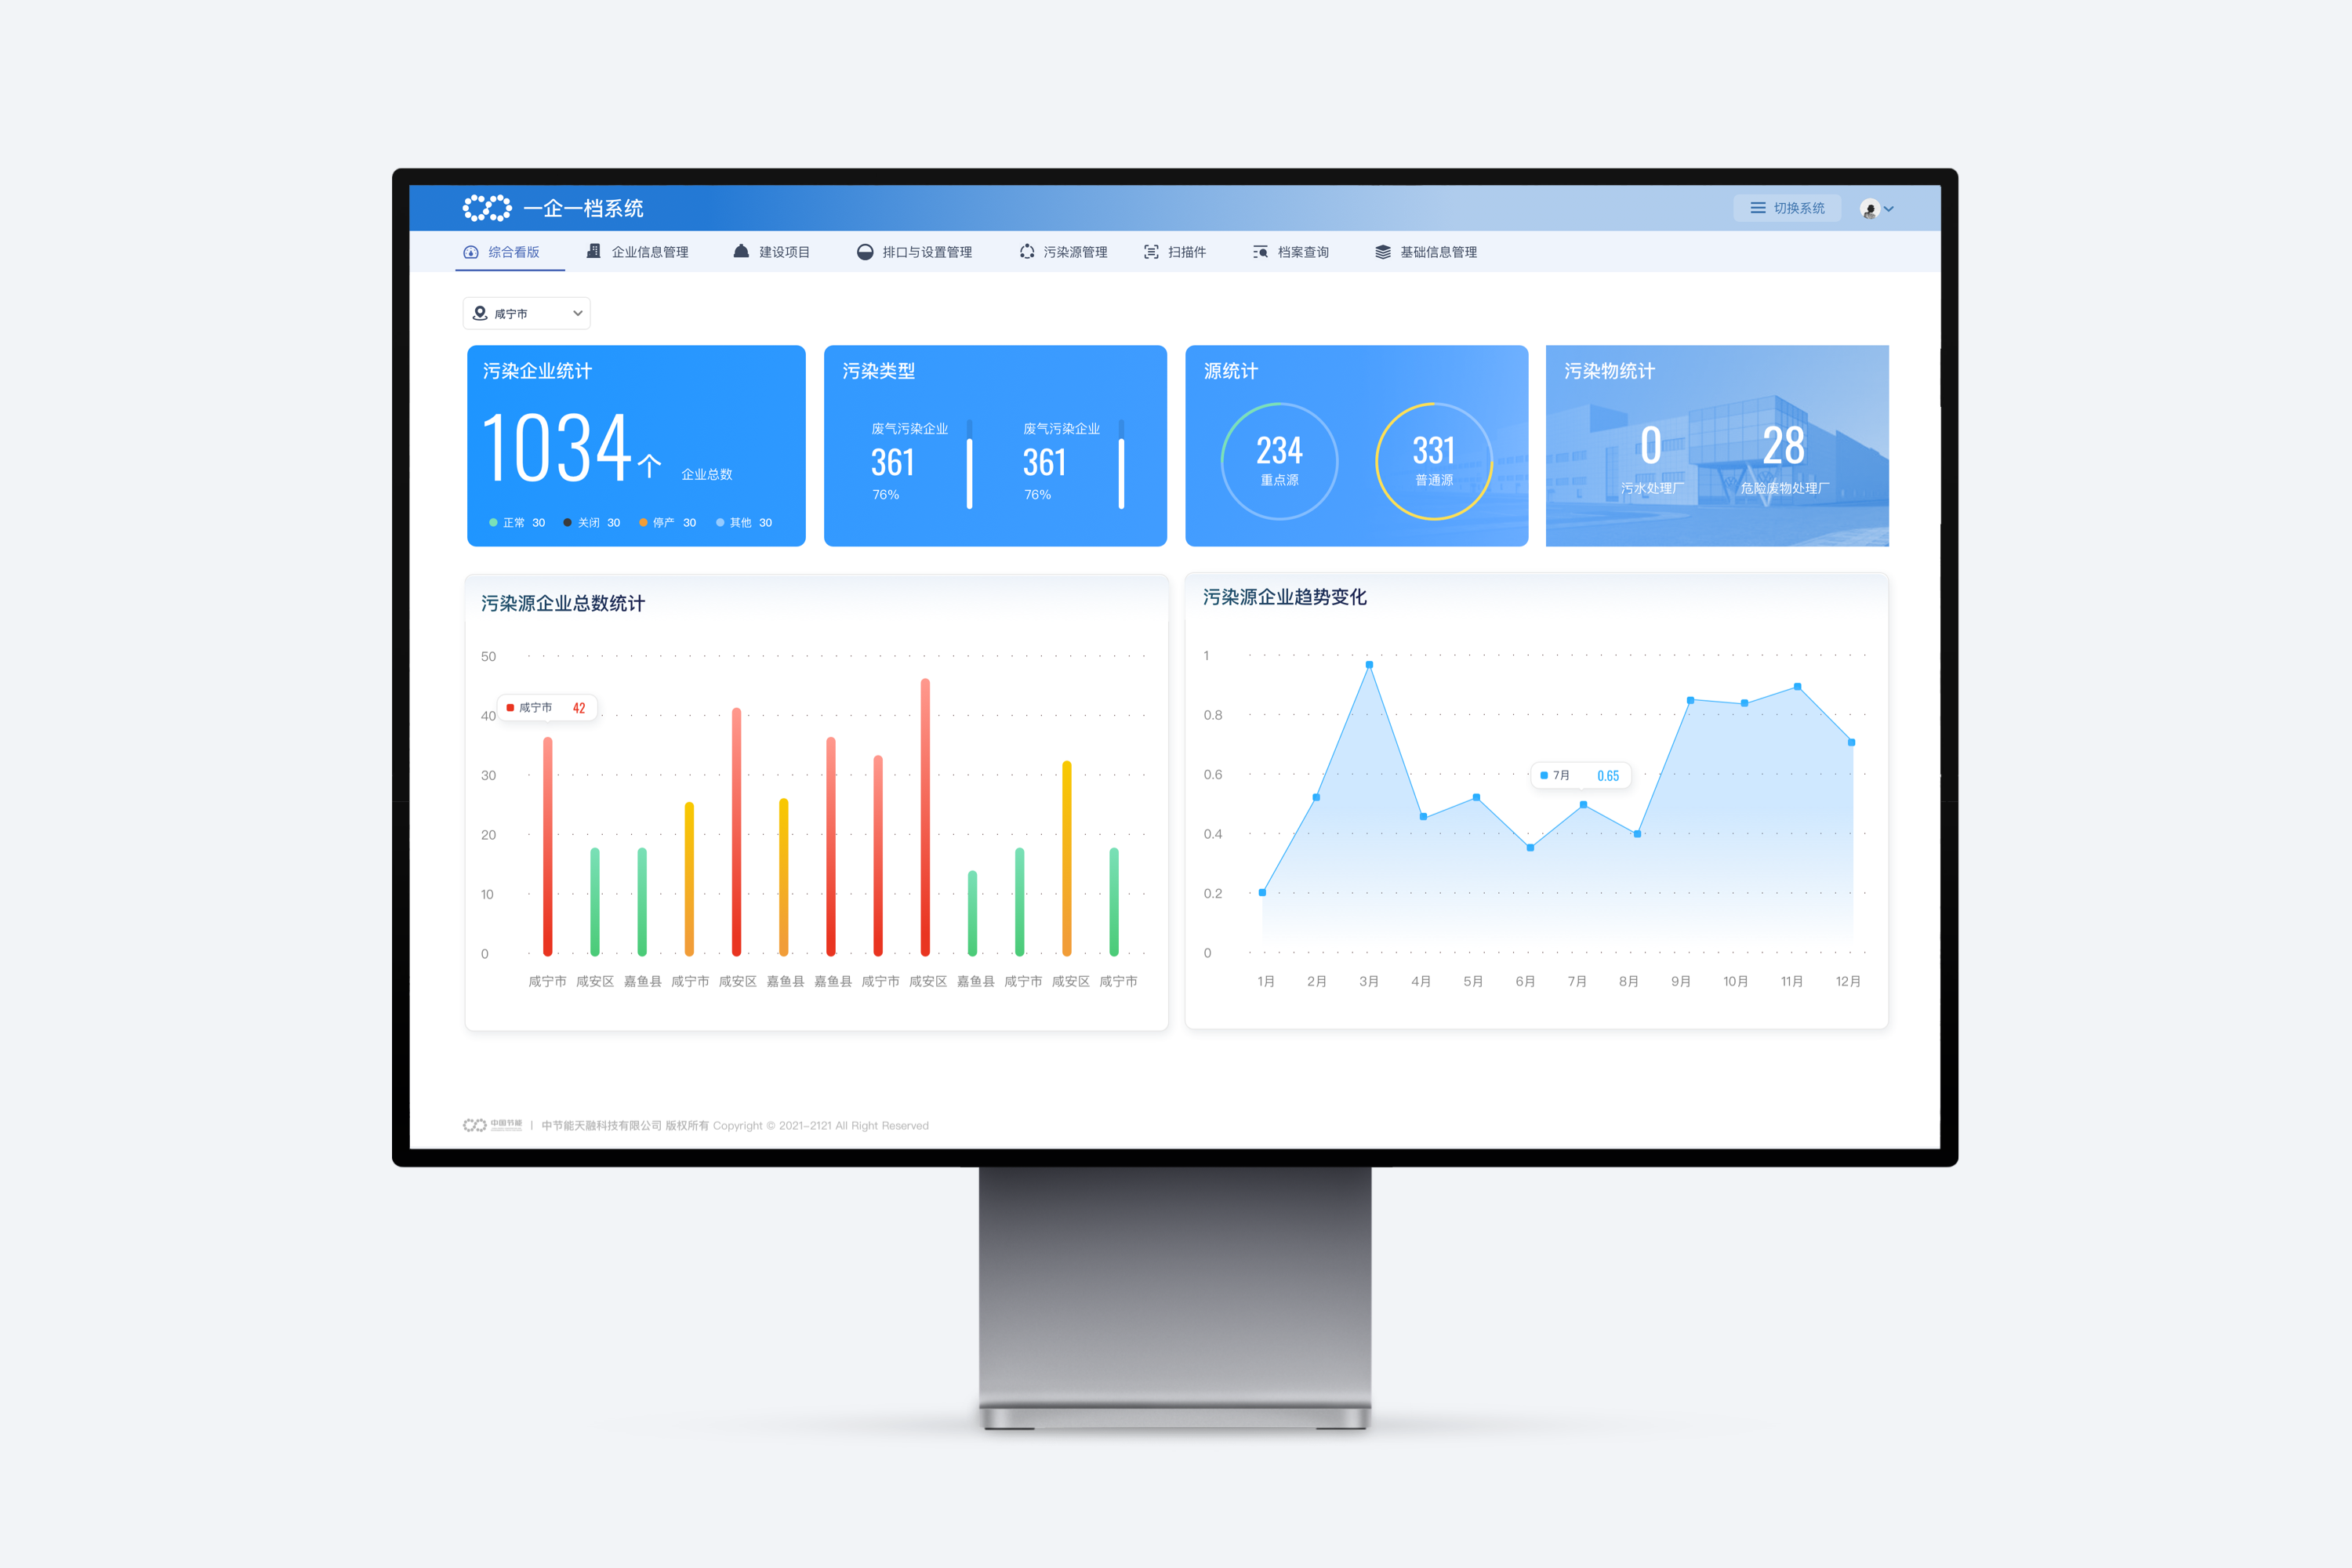 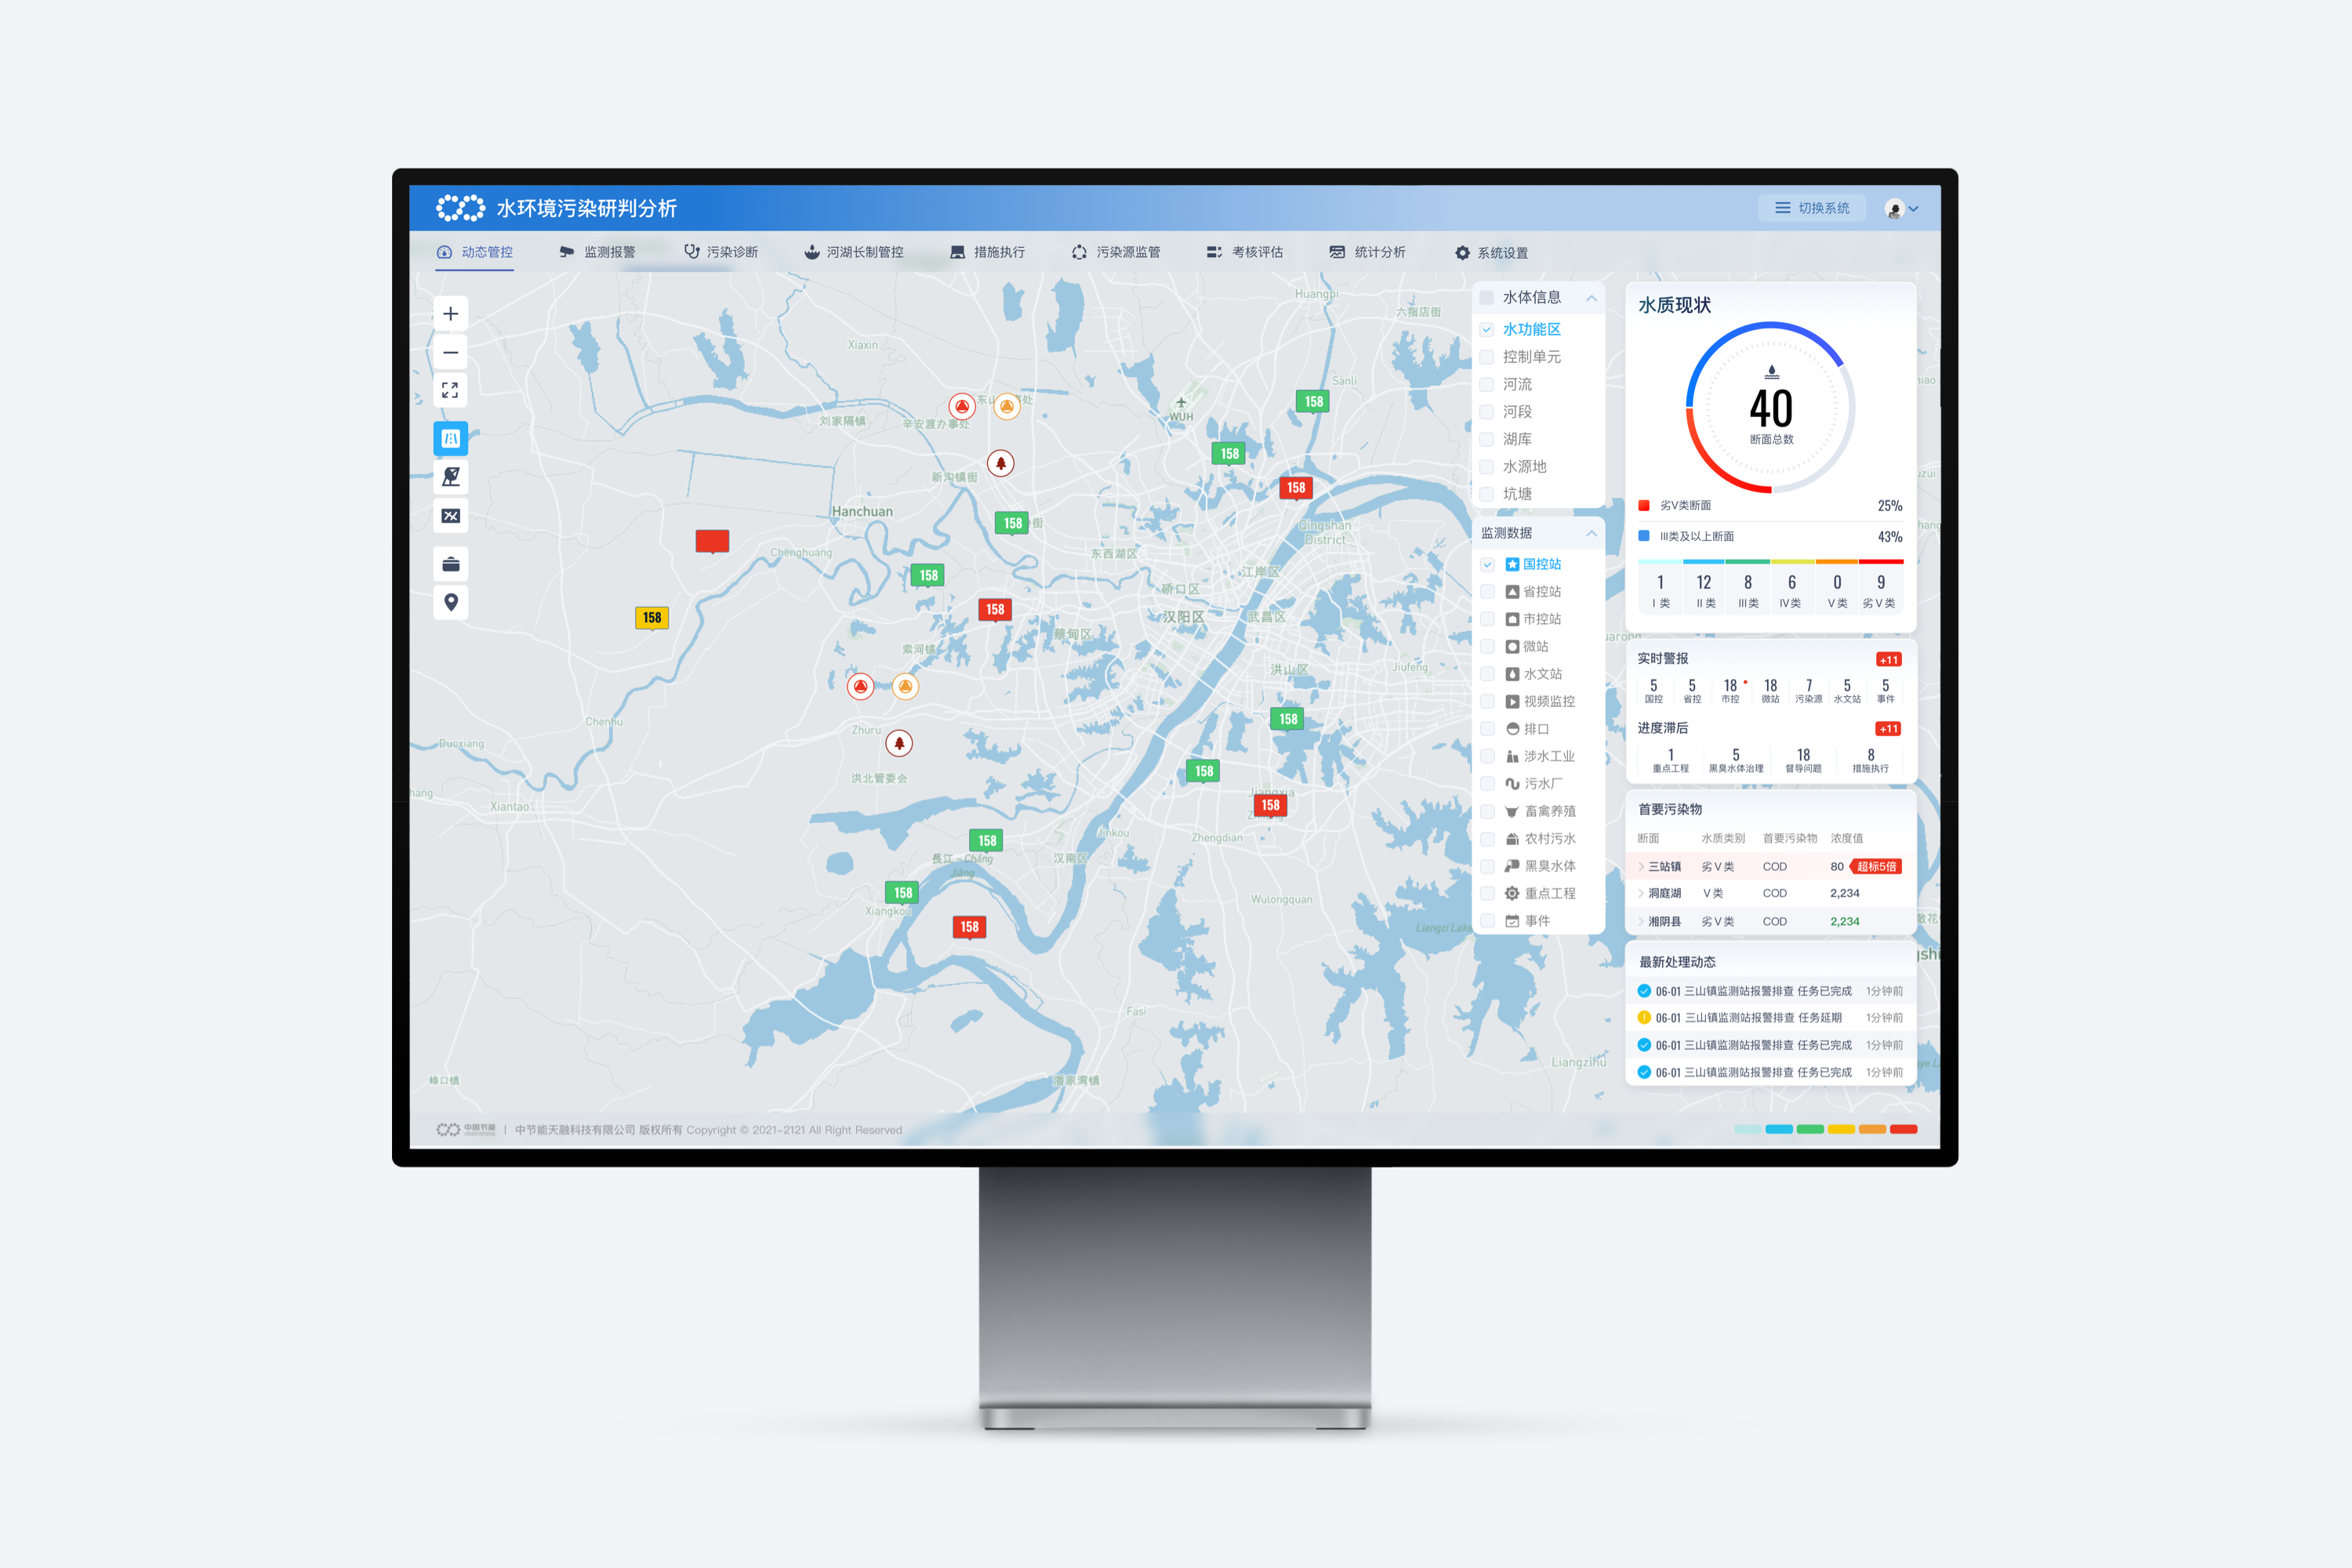 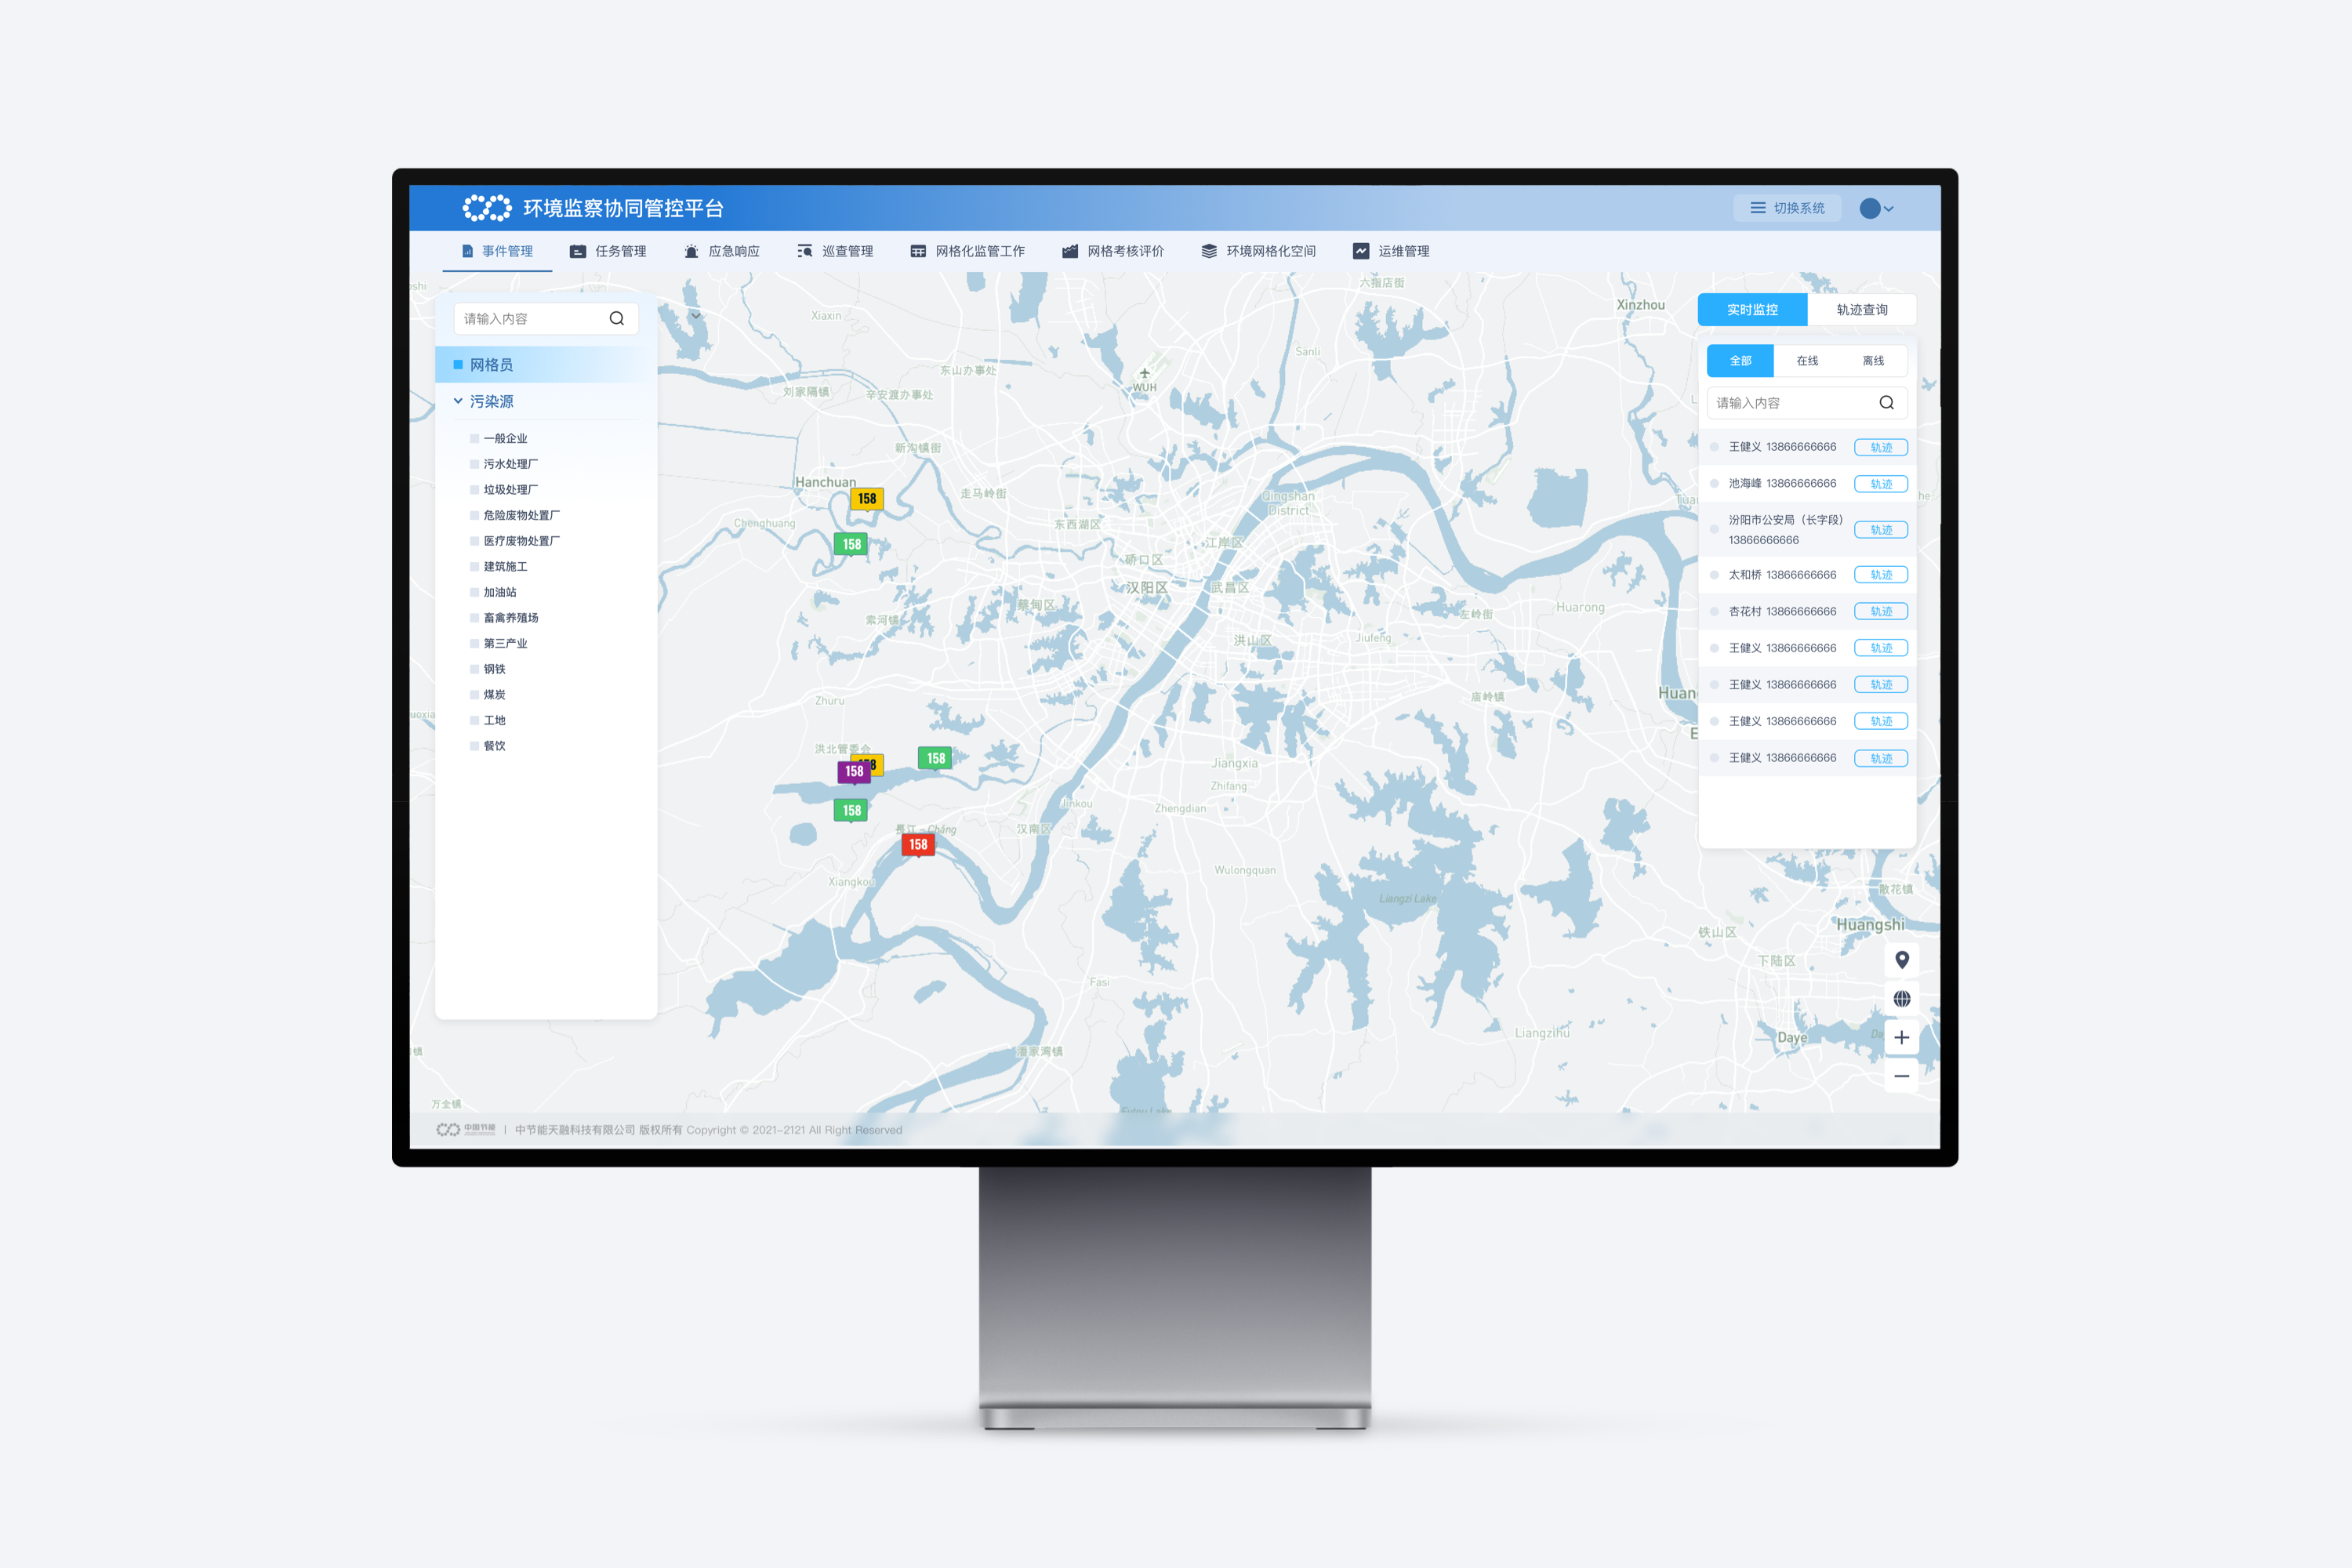 数据可视化的本质是数据空间到图形空间的映射,是抽象数据的具象表达。当理解了这一底层逻辑后,我们就会明白,对数据可视化做得一切设计都是为了更形象地表达数据内在的信息和规律,促进数据信息的传播和应用。 此次项目,我们希望通过设计创意、技术创新、以及文本梳理,增加界面数据的可读性,使得大屏可视化不至于「可视」,还可交流、可互动,更加有活力。 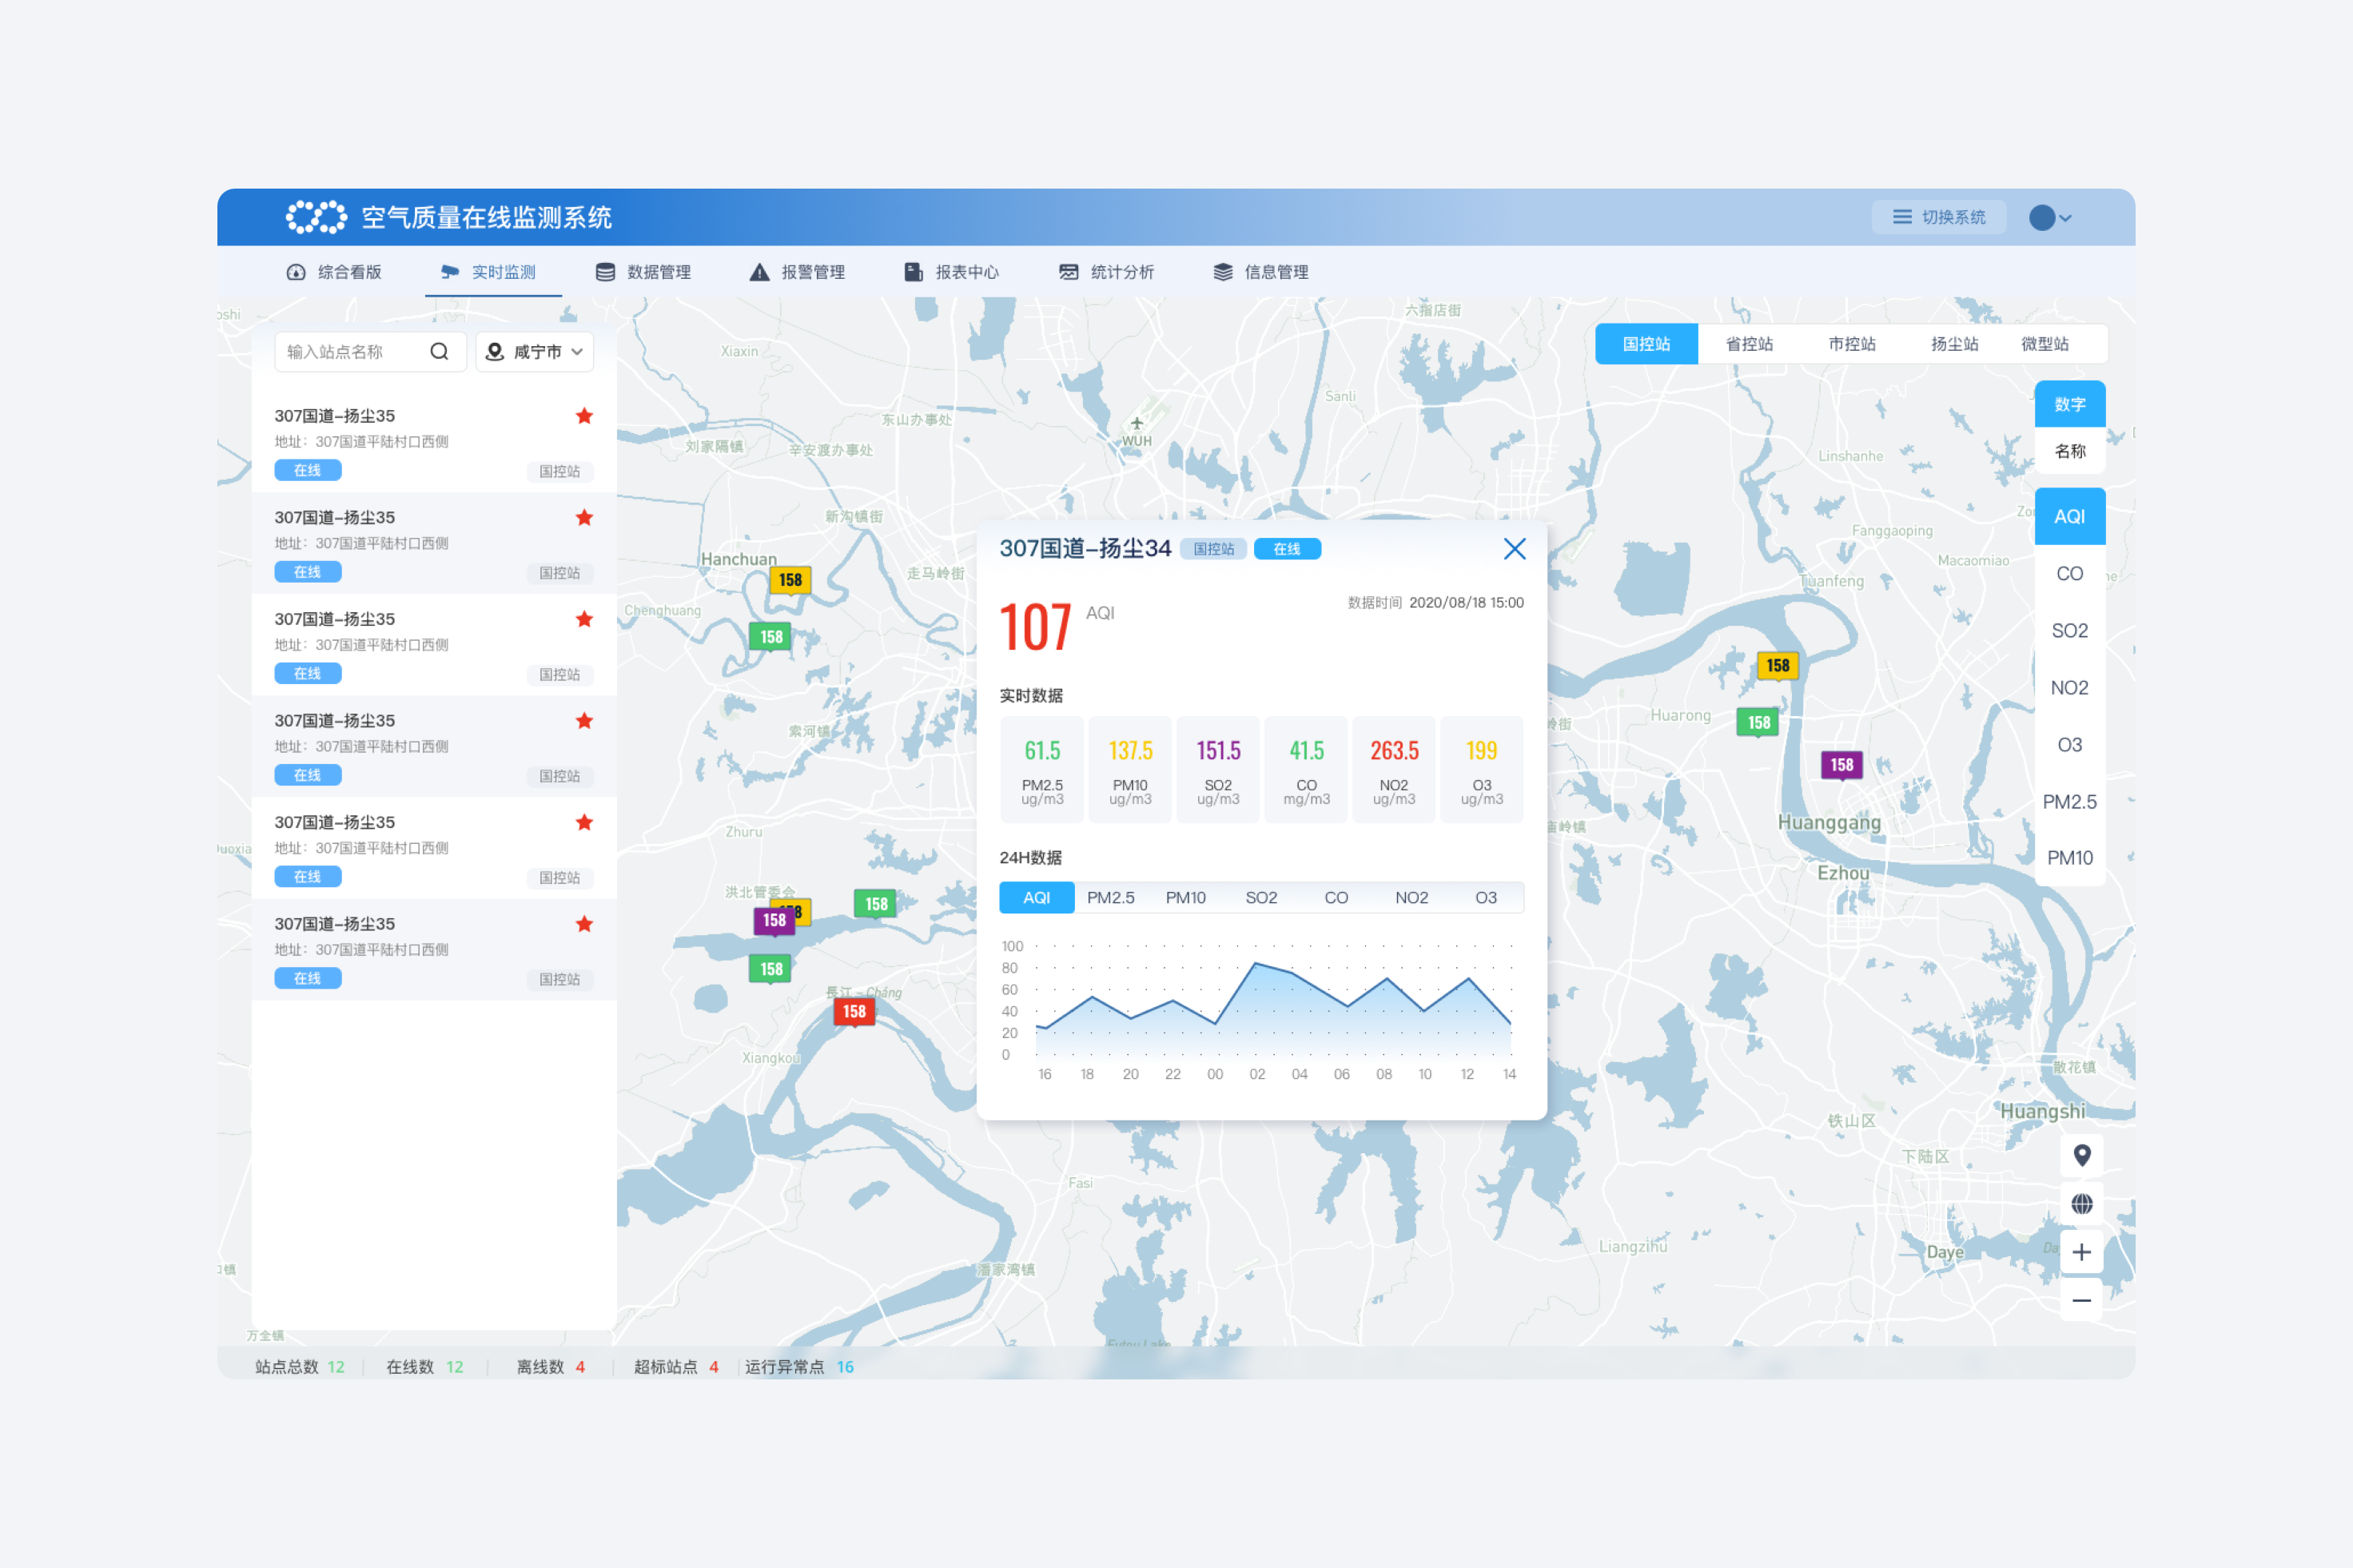 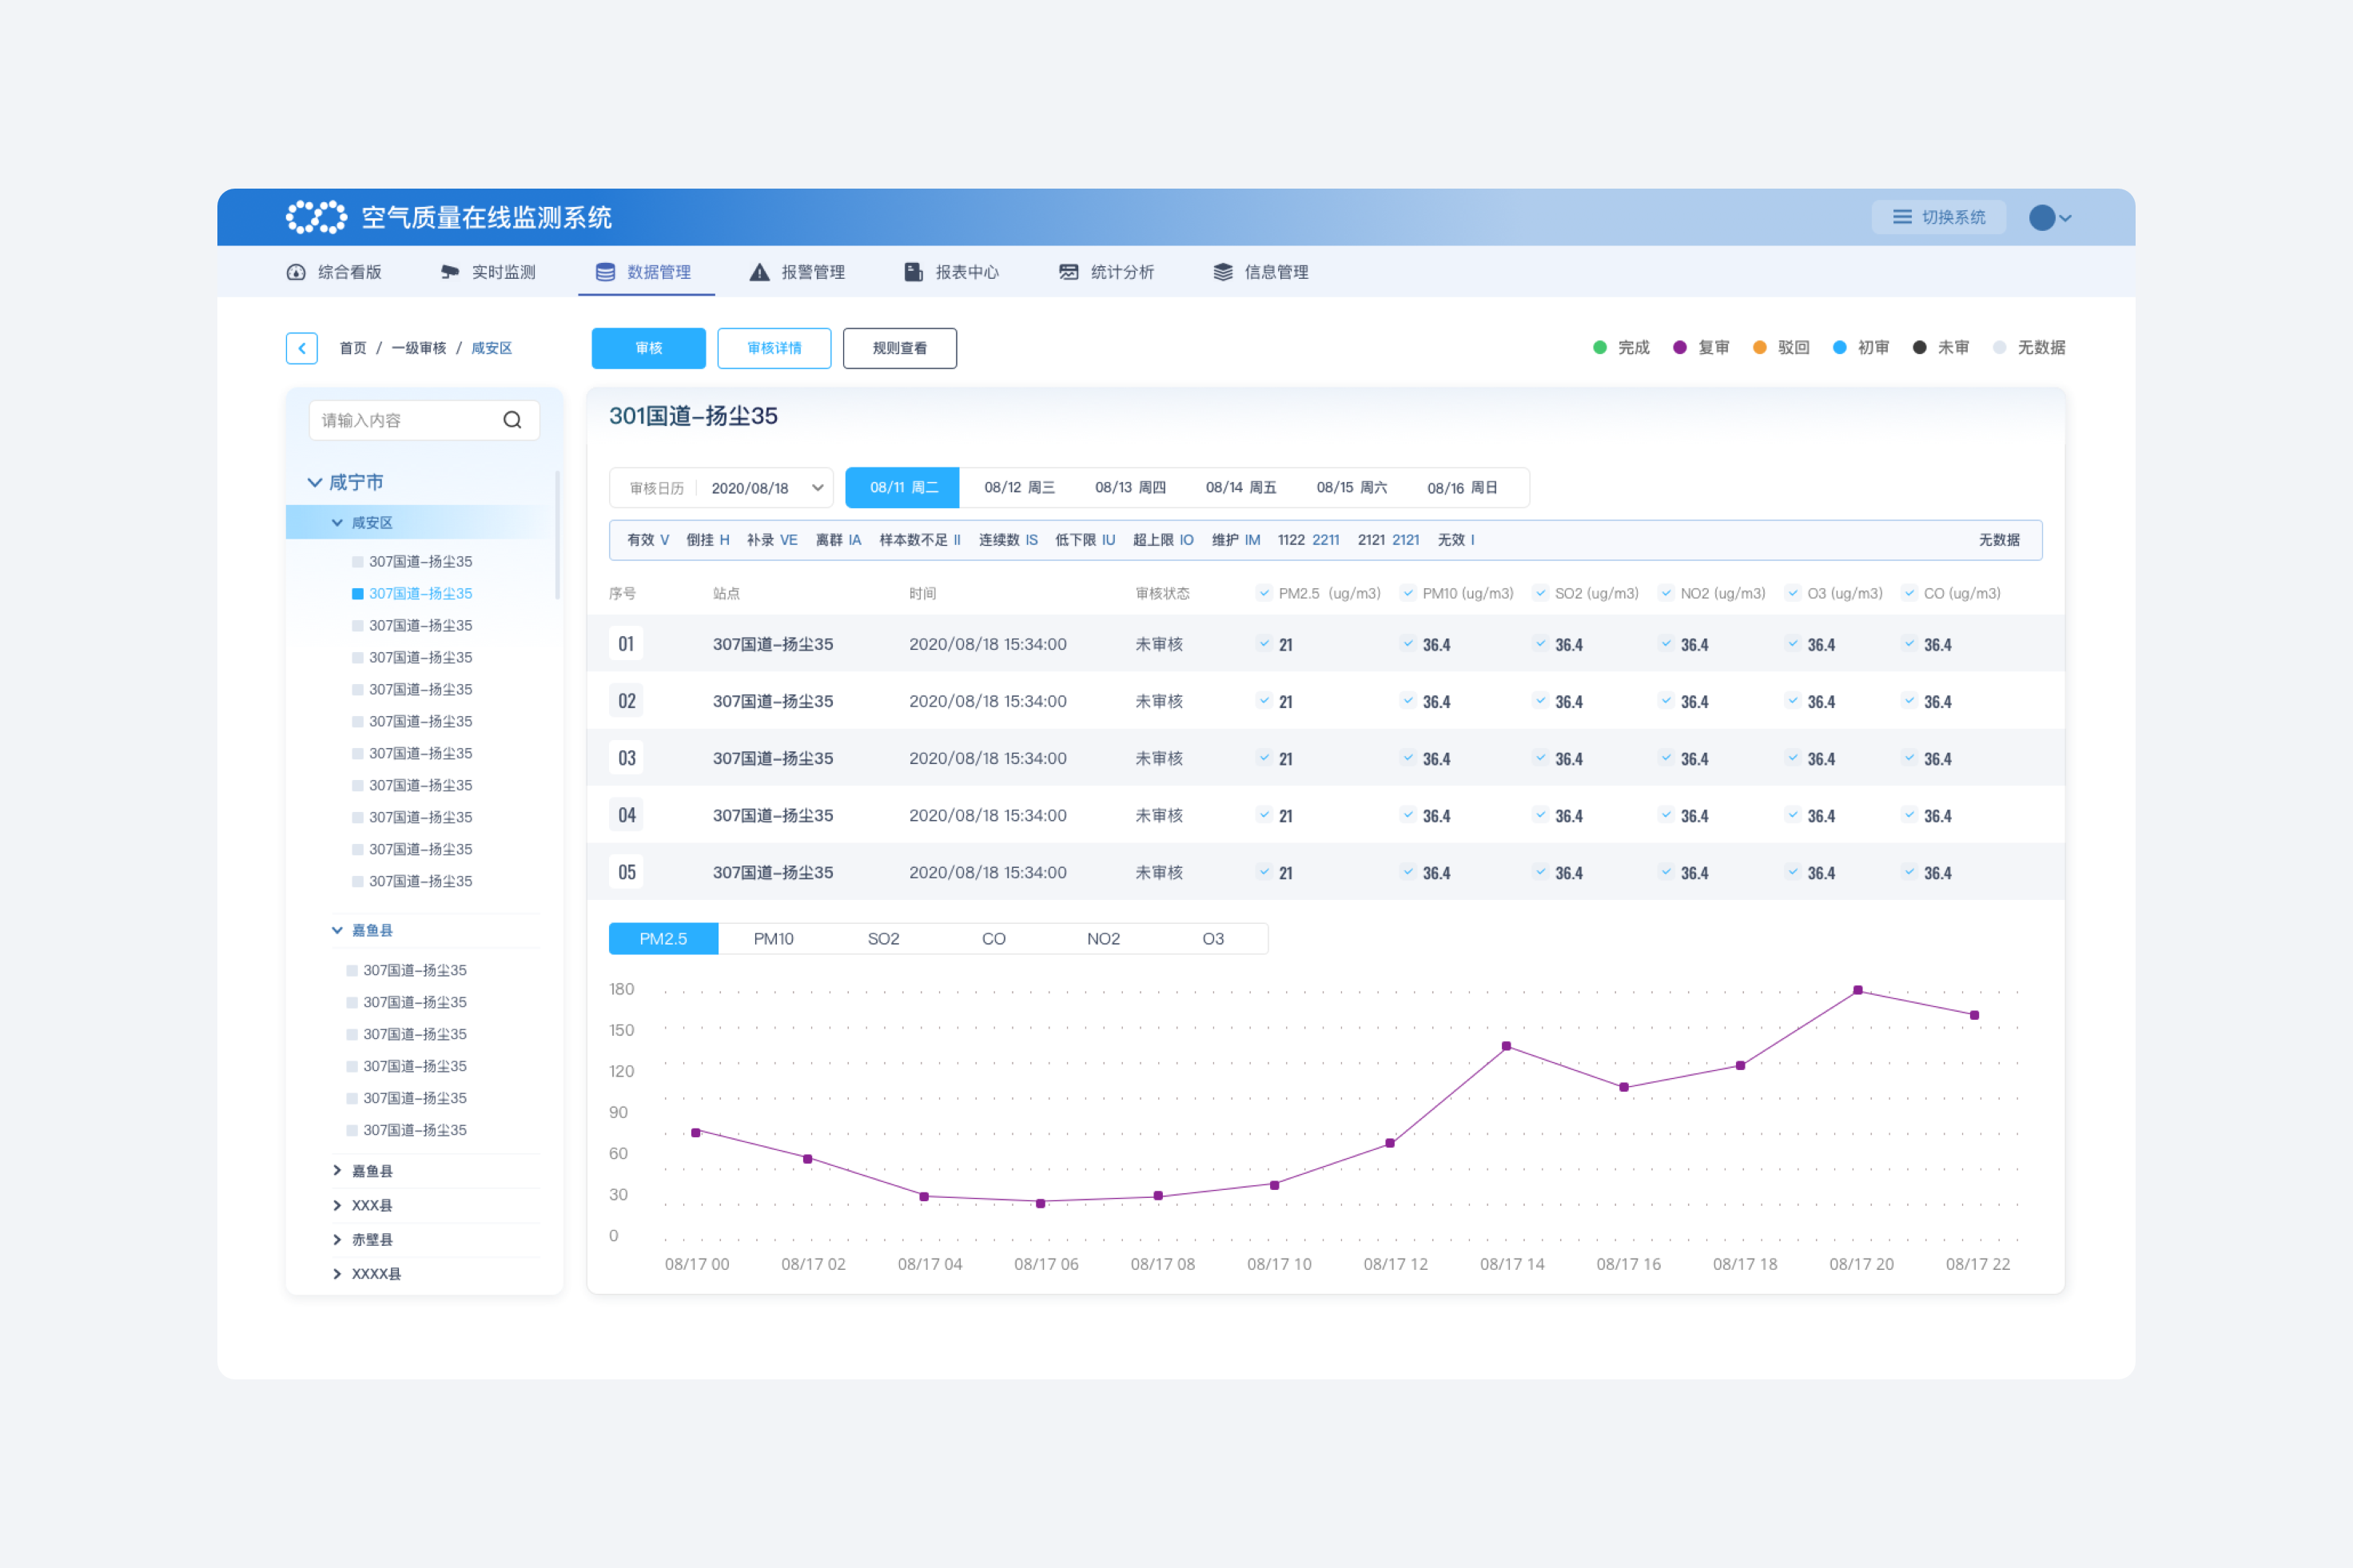 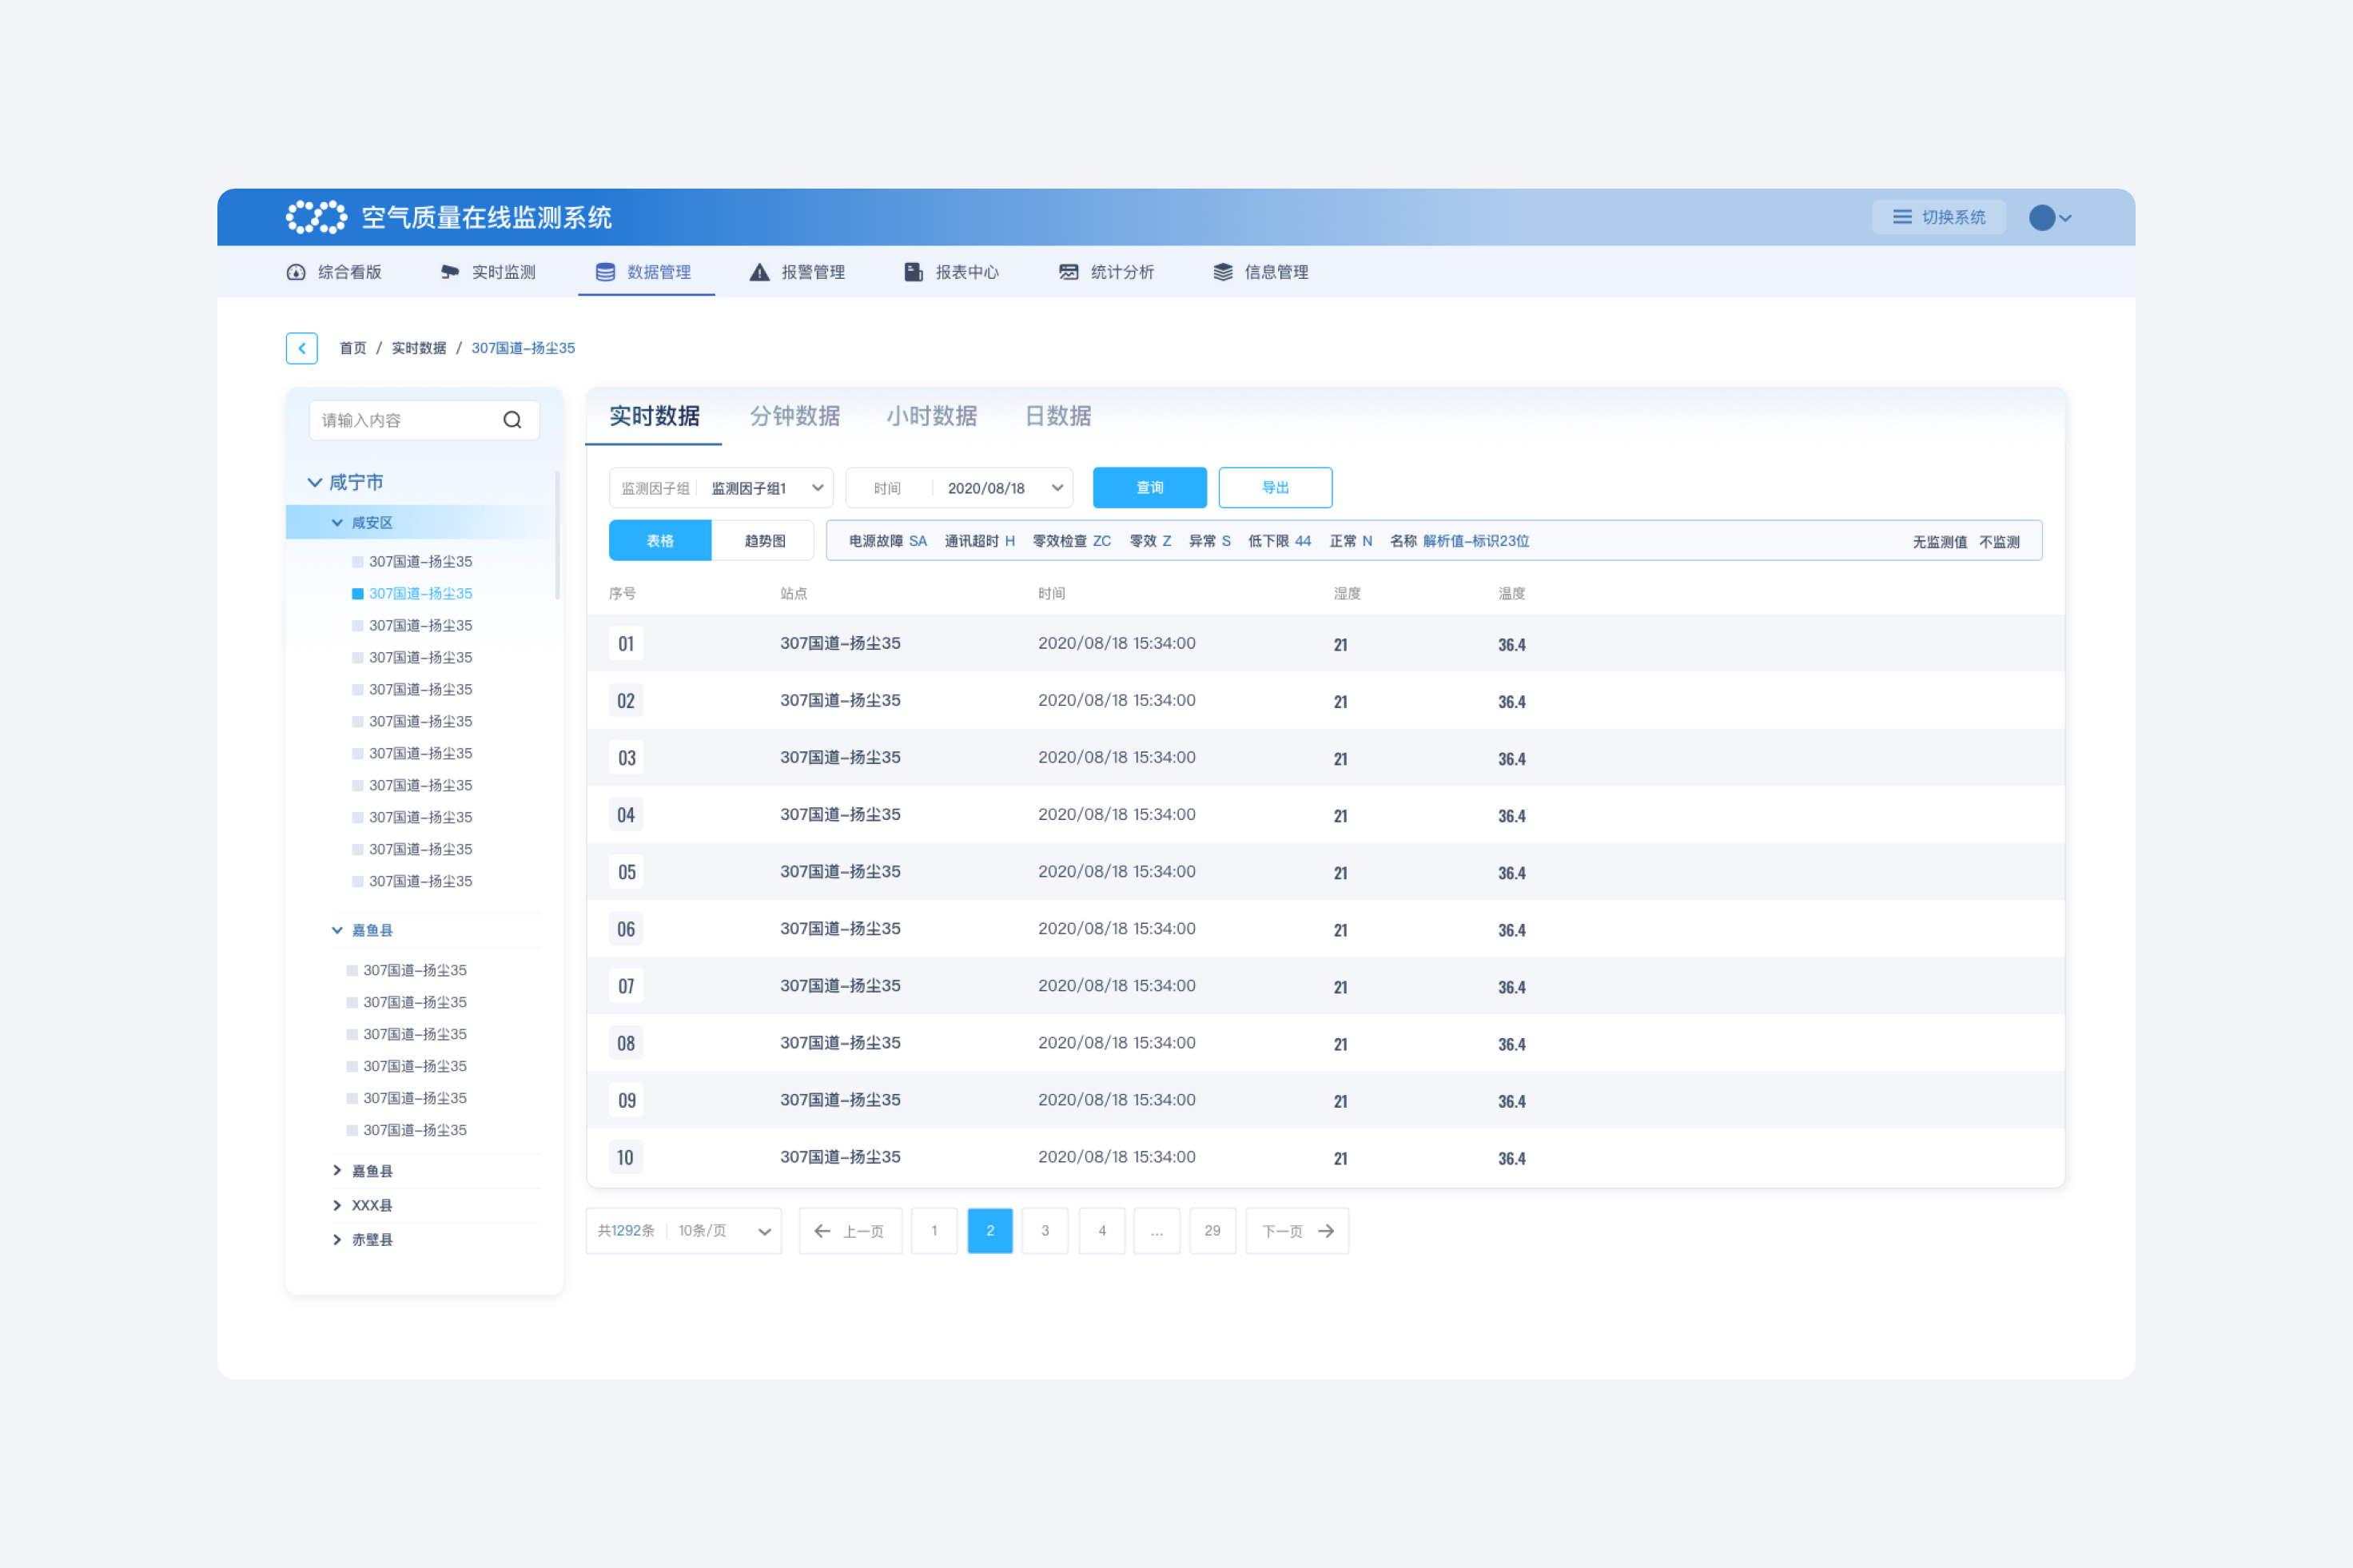 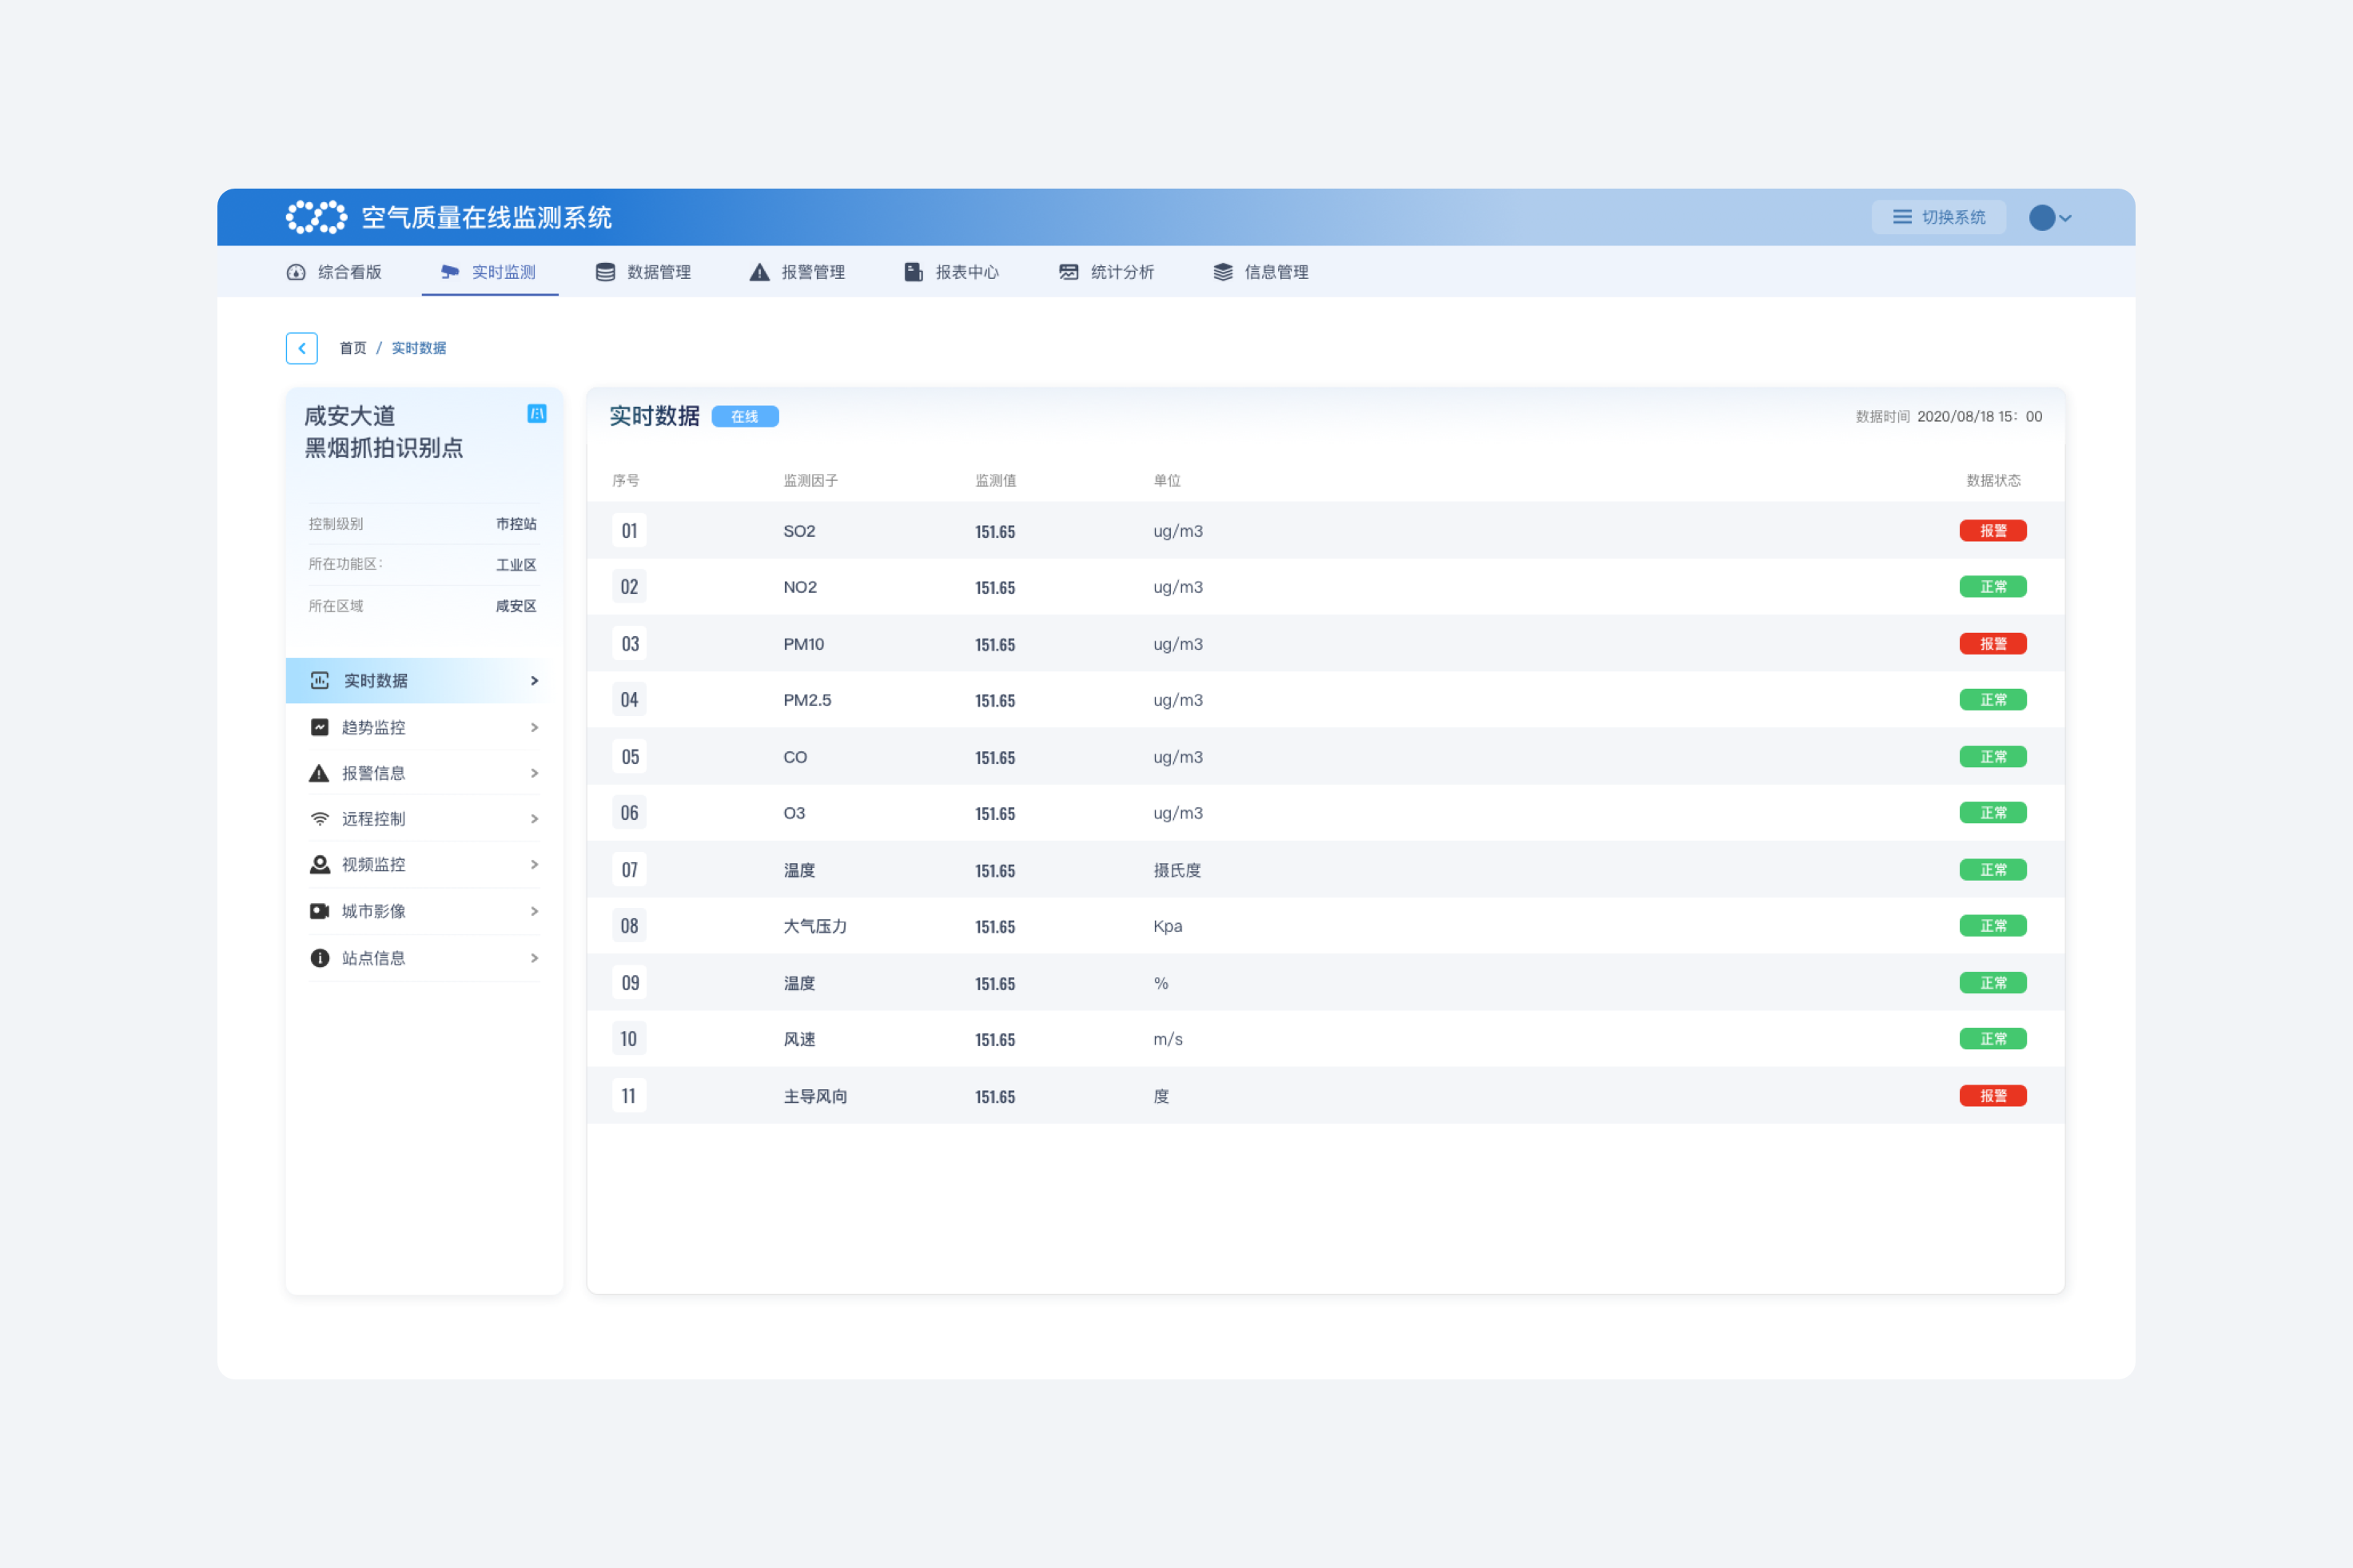 中节集团(CECEP)是大型科技类企业,随着全数字化时代到来,利用数字化技术搭建智慧型系统以及运营流程,智能高效的办公方式更能为企业带来便利与并降低操作成本。 我们基于对方的需求,利用领先的科技与智库,有效地为企业构建创新服务的新生态。 可视化大屏应用重要价值是理解展示的数据。所以我们最终的目的是为了让观者直观、准确地理解界面传达的信息,并且能够洞察未知的数据背后的信息。 ## English Content ### Introduction Entrusted by China energy conservation, we have designed a set of environmental quality monitoring platform for Xianning to open up the whole supervision process and realize the transformation and upgrading of regional ecological environment supervision. The platform covers the whole process of environmental protection work, integrates data analysis, regulatory decision-making, big data information and public service platform, and is subdivided into 17 subsystems. [Video](https://static.glabcms.stoyard.com/stoyard/gallery/20210714/vp8ljrbdag.mp4) The digital age has spawned a new ecological model, and high-frequency data interaction drives businesses to gradually migrate to digital. Both material producers and cultural exporters must adapt to changes in order to meet the refined needs of consumers, and many large enterprises have also entered transformation under this era of change. CECEP is the only state-owned enterprise whose main business is energy conservation, emission reduction and environmental protection. With the advent of the digital age, CECEP, as a large-scale enterprise that has undergone many optimizations and changes, takes "aggregating bits and pieces to create infinite" as its business philosophy, and strives to create a "whole industrial chain" that is energy-saving and environmentally friendly.  In 2021, STOYARD will cooperate with CECEP to build an environmental quality monitoring platform for Xianning. The Xianning environmental quality monitoring platform system has opened up the whole process of supervision and realized the transformation and upgrading of regional ecological environment supervision. The platform covers the entire process of environmental protection work, integrates data analysis, regulatory decision-making, big data information, and public service platforms, and is subdivided into 17 subsystems. In this project, we hope that through the design of big data, we will finally realize the "scientific, strict, refined, and long-term" management of the environment, so that the complex data can be turned into a visual system of images, graphs and texts.  The multi-platform intelligent management and control system for comprehensive management of Xianning water environment takes the rapid response of environmental monitoring data, the unified coordination of business data, and efficient analysis and processing as the primary goals. Therefore, how to efficiently, accurately and clearly integrate such a huge "information volume" is the first difficulty that the STOYARD team will overcome after undertaking this project. Through research before design, we extracted some keywords from customer needs to standardize the design direction. The words "infinity, intelligence, technology, future" make it clear that our designs should spread around these points.  The trend of data changes is more intuitive. The data information is displayed on the large screen through the combination of graphs and figures such as bar charts and line charts. The changes of information are more clear at a glance, which is convenient for users to view the current information and the comparison between information in real time. The trend of data changes is more intuitive. The data information is displayed on the large screen through the combination of graphs and figures such as bar charts and line charts. The changes of information are more clear at a glance, which is convenient for users to view the current information and the comparison between information in real time.   In the process of designing the data visualization interface, the difficulty lies in how to layout and typeset the complex and numerous information, and how to combine the charts to make the information more concise and intuitive, which is both powerful and beautiful. The whole system has become a large-screen display system with high brightness, high definition, high intelligent control and advanced operation method. In the process of designing the data visualization interface, the difficulty lies in how to layout and typeset the complex and numerous information, and how to combine the charts to make the information more concise and intuitive, which is both powerful and beautiful. The whole system has become a large-screen display system with high brightness, high definition, high intelligent control and advanced operation method.   In visual design, we improve the framework logic by customizing icons, tables, and sorting out the position of the text area to achieve the balance of each element. Users can easily find something and quickly understand the meaning of the data. The overall design scheme must ensure the aesthetics of the interface while optimizing its function and experience. [Video](https://static.glabcms.stoyard.com/stoyard/gallery/20210715/558epeo98dq.mp4) We bring a large screen full of personalization, layering, and space through design. The use of color is more convenient to highlight important data content with different meanings, bringing a different comfort to the office. We hope that good content will be presented in a beautiful, smooth and intuitive way; the content will be reasonably arranged so that it will finally present a logically clear and visually eye-catching effect, which can match the concept and status of the Great Group.  In accordance with the concept and framework of "digital environmental protection", we adopt a unified data model and data standards to establish a multi-source, multi-temporal, multi-scale environmental emergency and comprehensive management decision-making information platform, realizing information exchange and sharing in multiple fields.     The essence of data visualization is the mapping from data space to graphic space, and it is the concrete expression of abstract data. When we understand this underlying logic, we will understand that all designs for data visualization are to more vividly express the inherent information and laws of data, and to promote the dissemination and application of data information. In this project, we hope to increase the readability of interface data through design creativity, technological innovation, and text sorting, so that the large-screen visualization will not be "visual", but also can communicate, interact, and be more dynamic.     CECEP is a large technology enterprise. With the advent of the all-digital era, the use of digital technology to build intelligent systems and operation processes, intelligent and efficient office methods can bring convenience to enterprises and reduce operating costs. Based on the needs of the other party, we use leading technology and think tanks to effectively build a new ecosystem of innovative services for enterprises. The important value of visualizing large-screen applications is to understand the displayed data. So our ultimate goal is to allow the viewer to intuitively and accurately understand the information conveyed by the interface, and to gain insight into the information behind the unknown data.