# 中国节能 / 环境污染研判管控系统

- ID: 204
- URL: https://www.stoyard.com/works/204
- English URL: https://www.stoyard.com/en/works/204
- Year: 2020
- Cover: https://static.glabcms.stoyard.com/stoyard/project/cover/20211209/8rwppku9v0x.jpg
- Categories: 软件设计解决方案, 视频、动态图形、动画设计
- English Categories: Software Design Solution, Motion Graphics
- Author: STOYARD
- English Author: STOYARD
- Publish: 2020-04-18
- Editor: STOYARD SHANGHAI

## 中文主体

### 项目简介

“大气污染精细化动态管控”“水污染精细化动态管控”是委托我司设计的一套数据可视化GIS后台系统。其主要功能为搜索定位各行政区划的污染区域,查看每个区域的大气及污水相关信息数据并对其追根溯源。通过直观的信息展示及分析,查找污染源,为政务工作者的整改工作提供可靠直观的地图信息数据。
对各种污染源,监测站,及污染企业等进行实时监测、报警,通过发起管控、排查来推进污染整改,并对整改措施及成果进行监督。实现对各个污染区域的综合管理及追踪,建立长效的防污染巡检机制,解决反复治理及治理难的问题。

![](https://static.glabcms.stoyard.com/object/20200418/jrv3kep1f7q.png)

![](https://static.glabcms.stoyard.com/object/20200417/1nuilkerpfr.png)

![](https://static.glabcms.stoyard.com/object/20200417/q504soyzrn.png)

![](https://static.glabcms.stoyard.com/object/20200417/wudvthit57k.png)

![](https://static.glabcms.stoyard.com/object/20200417/pac38sx1iq.png)

![](https://static.glabcms.stoyard.com/object/20200416/nb0ve1f6jcc.png)

![](https://static.glabcms.stoyard.com/object/20200416/cqvto4urhe7.png)

![](https://static.glabcms.stoyard.com/object/20200416/wohgx4opbeg.png)

![](https://static.glabcms.stoyard.com/object/20200416/y4jvnrc1lke.png)

![](https://static.glabcms.stoyard.com/object/20200416/7w8tbdl98bt.png)

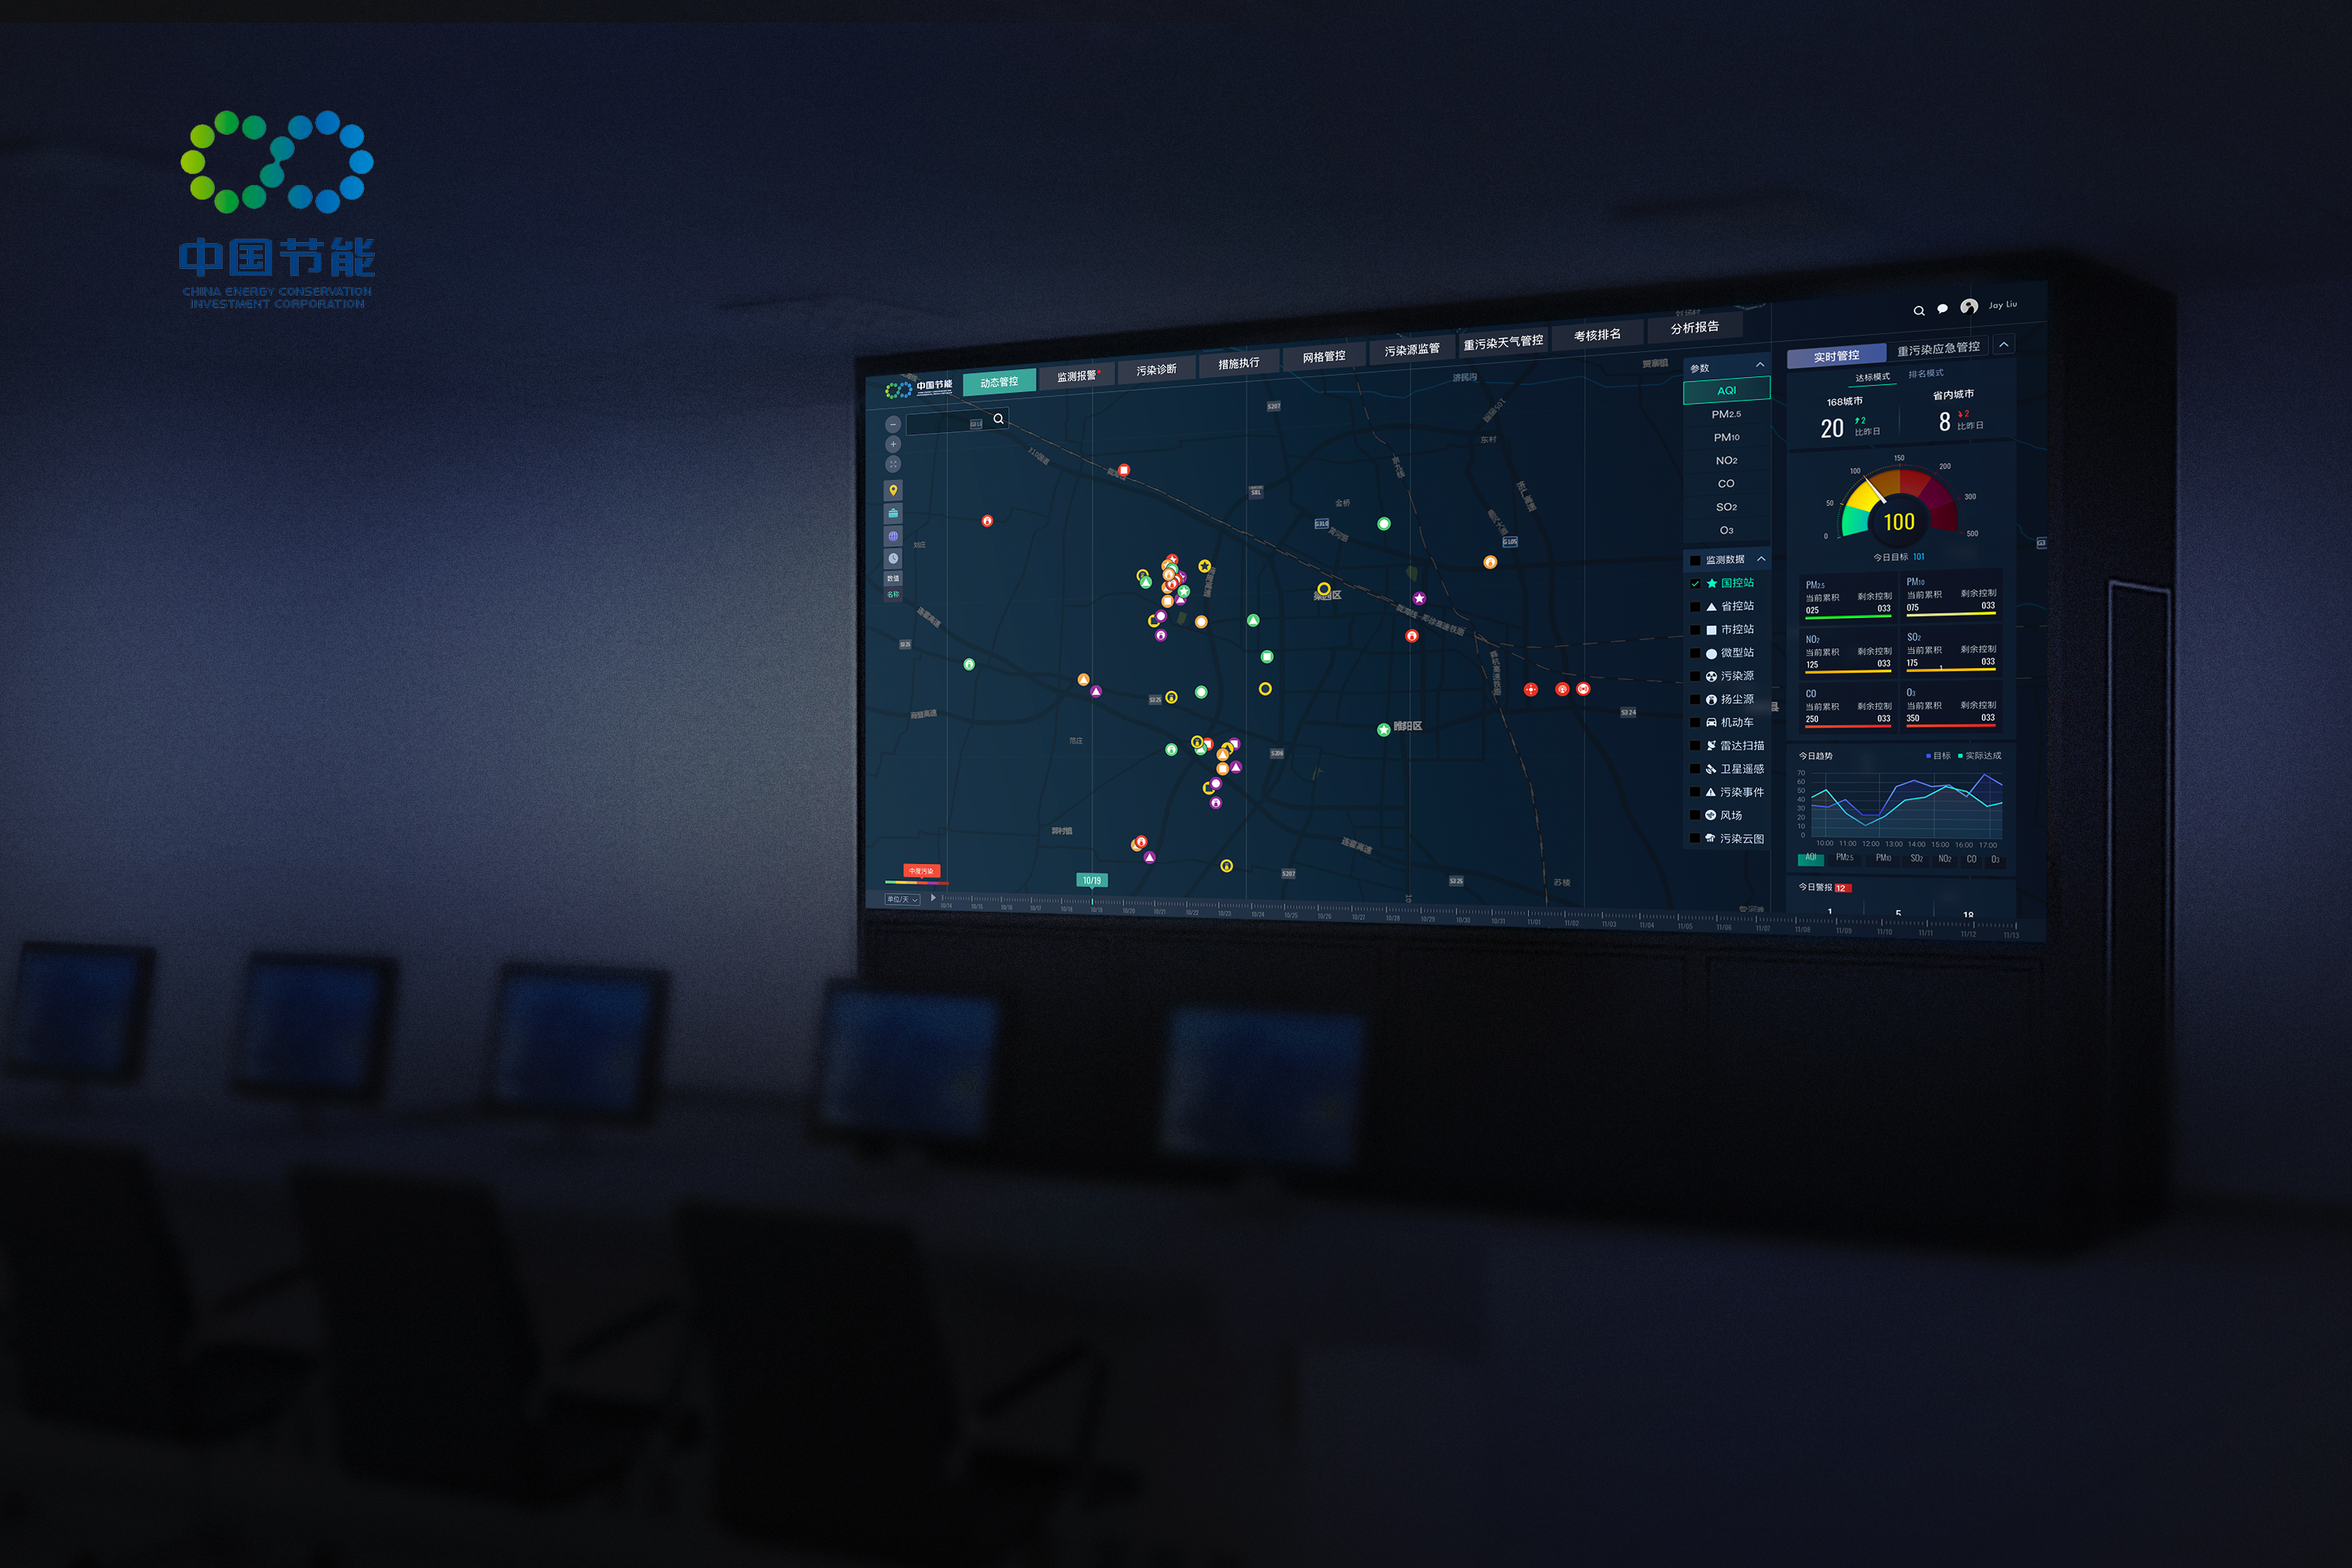
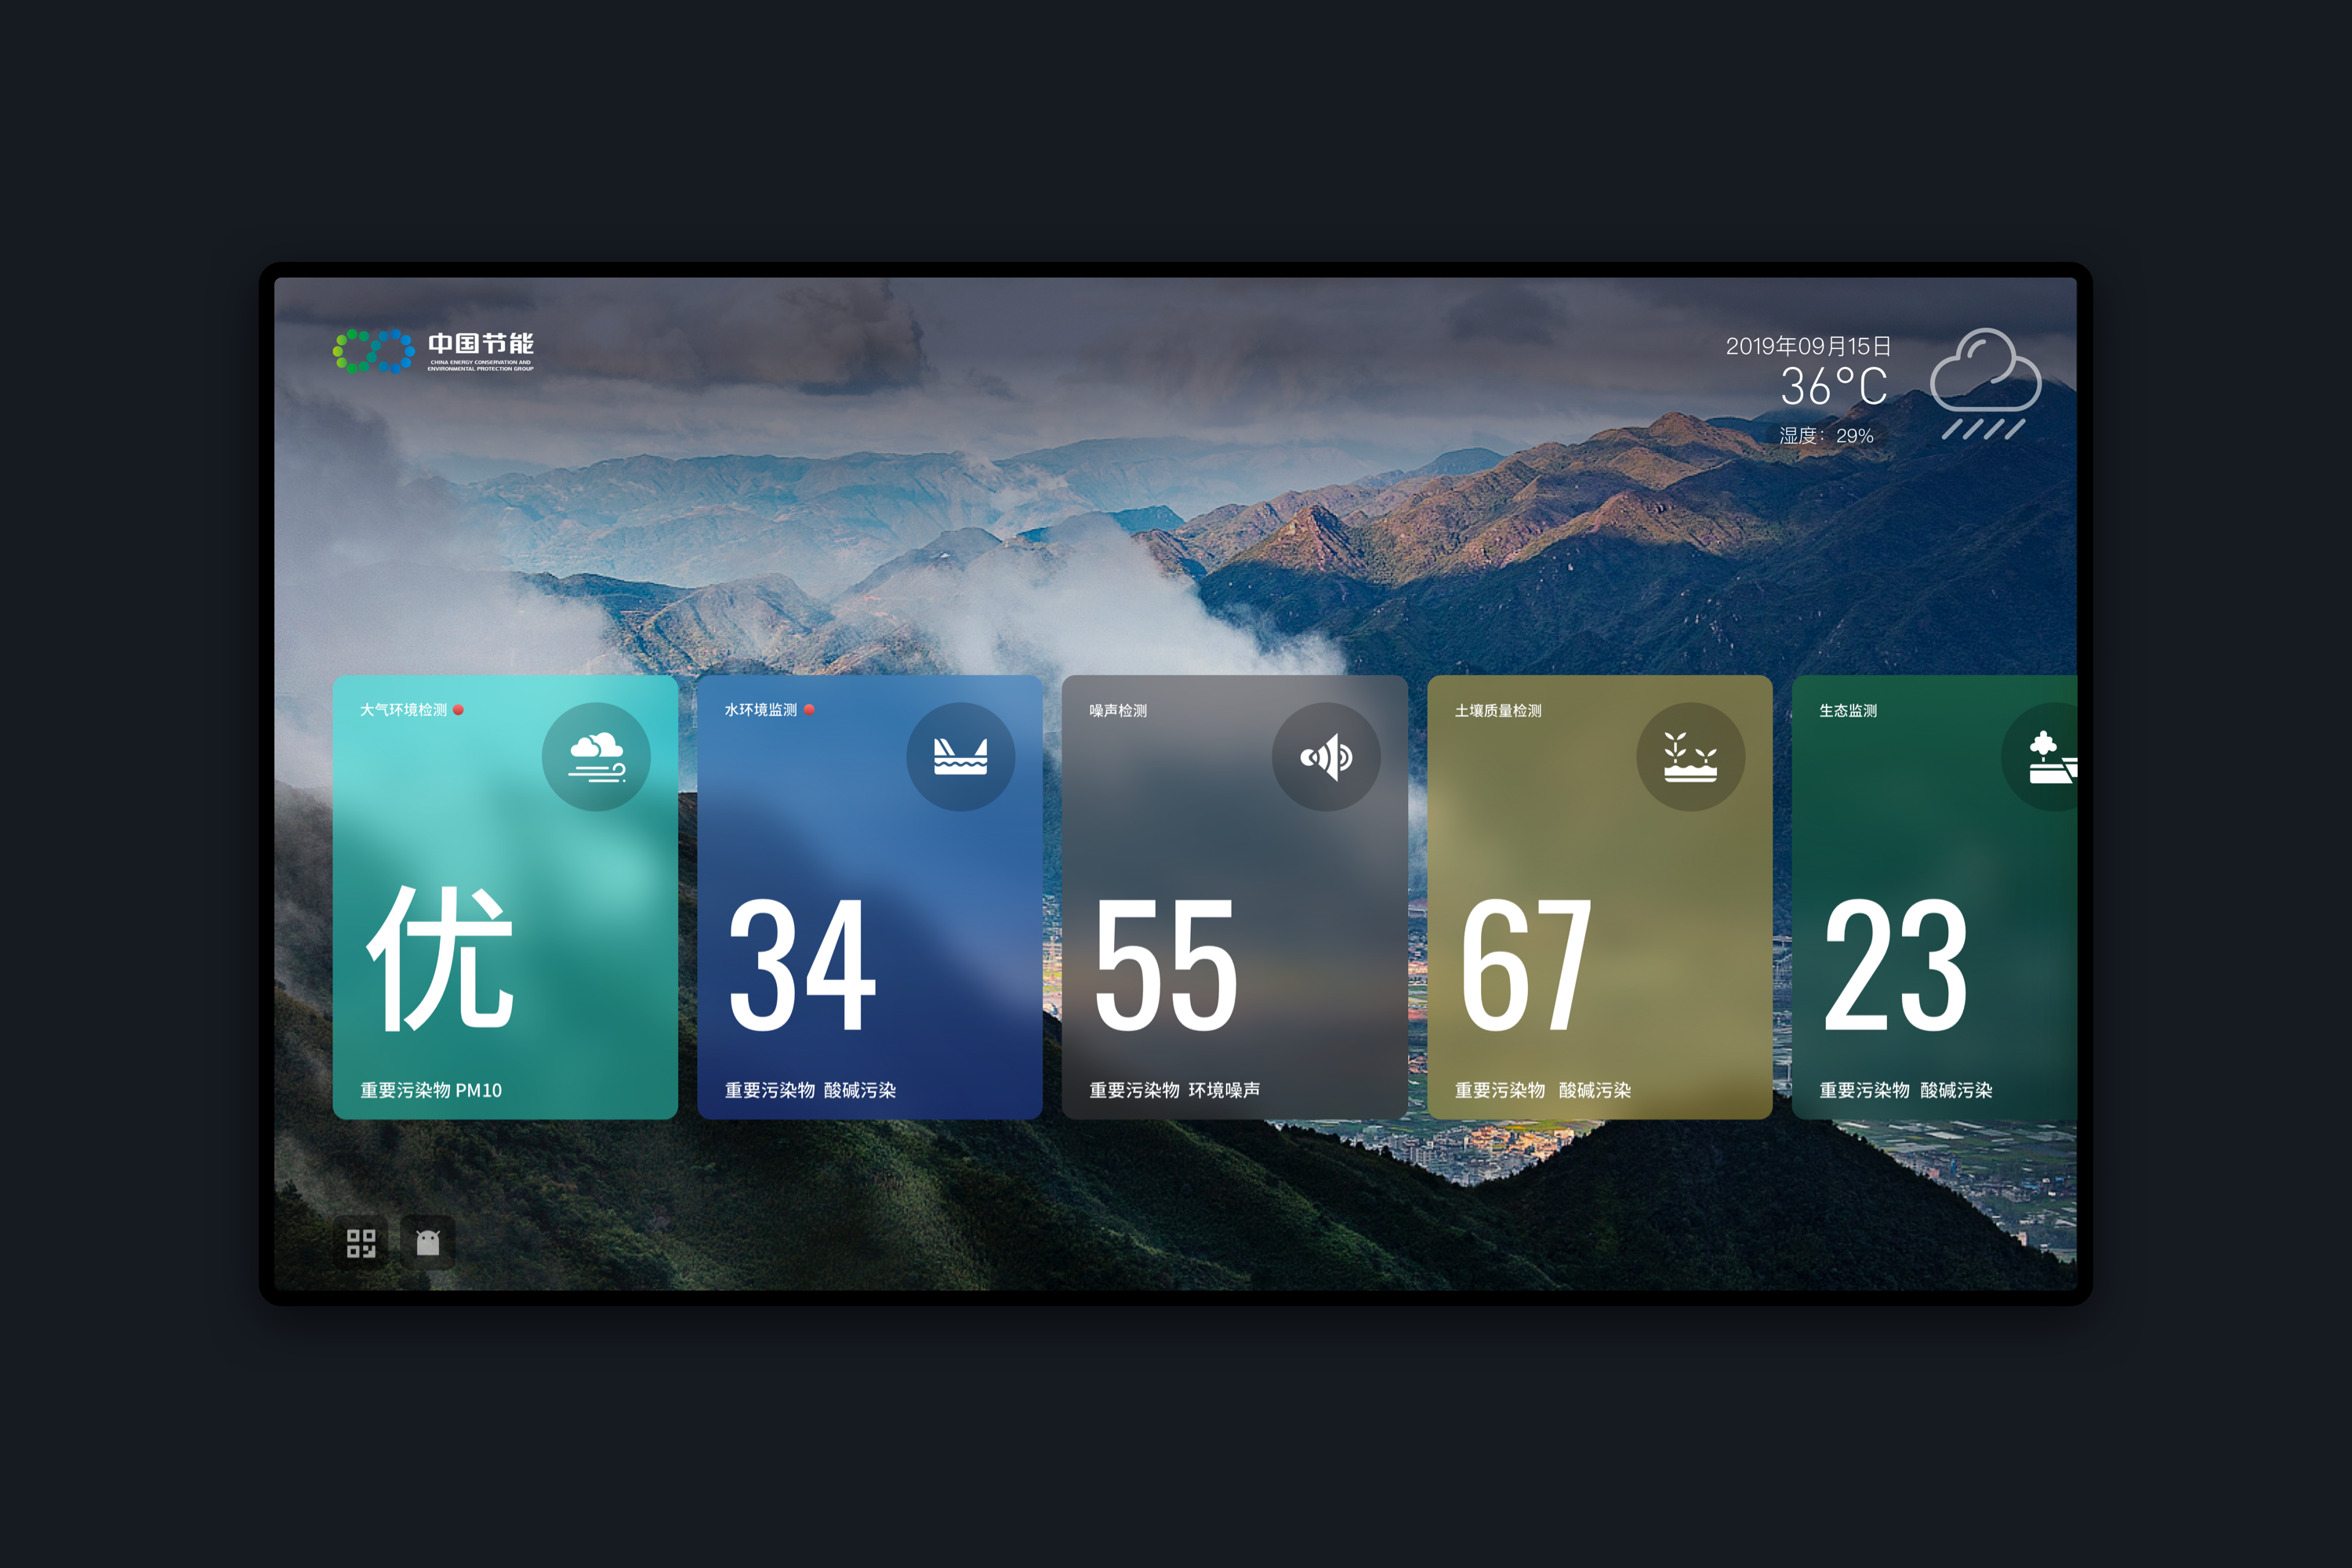
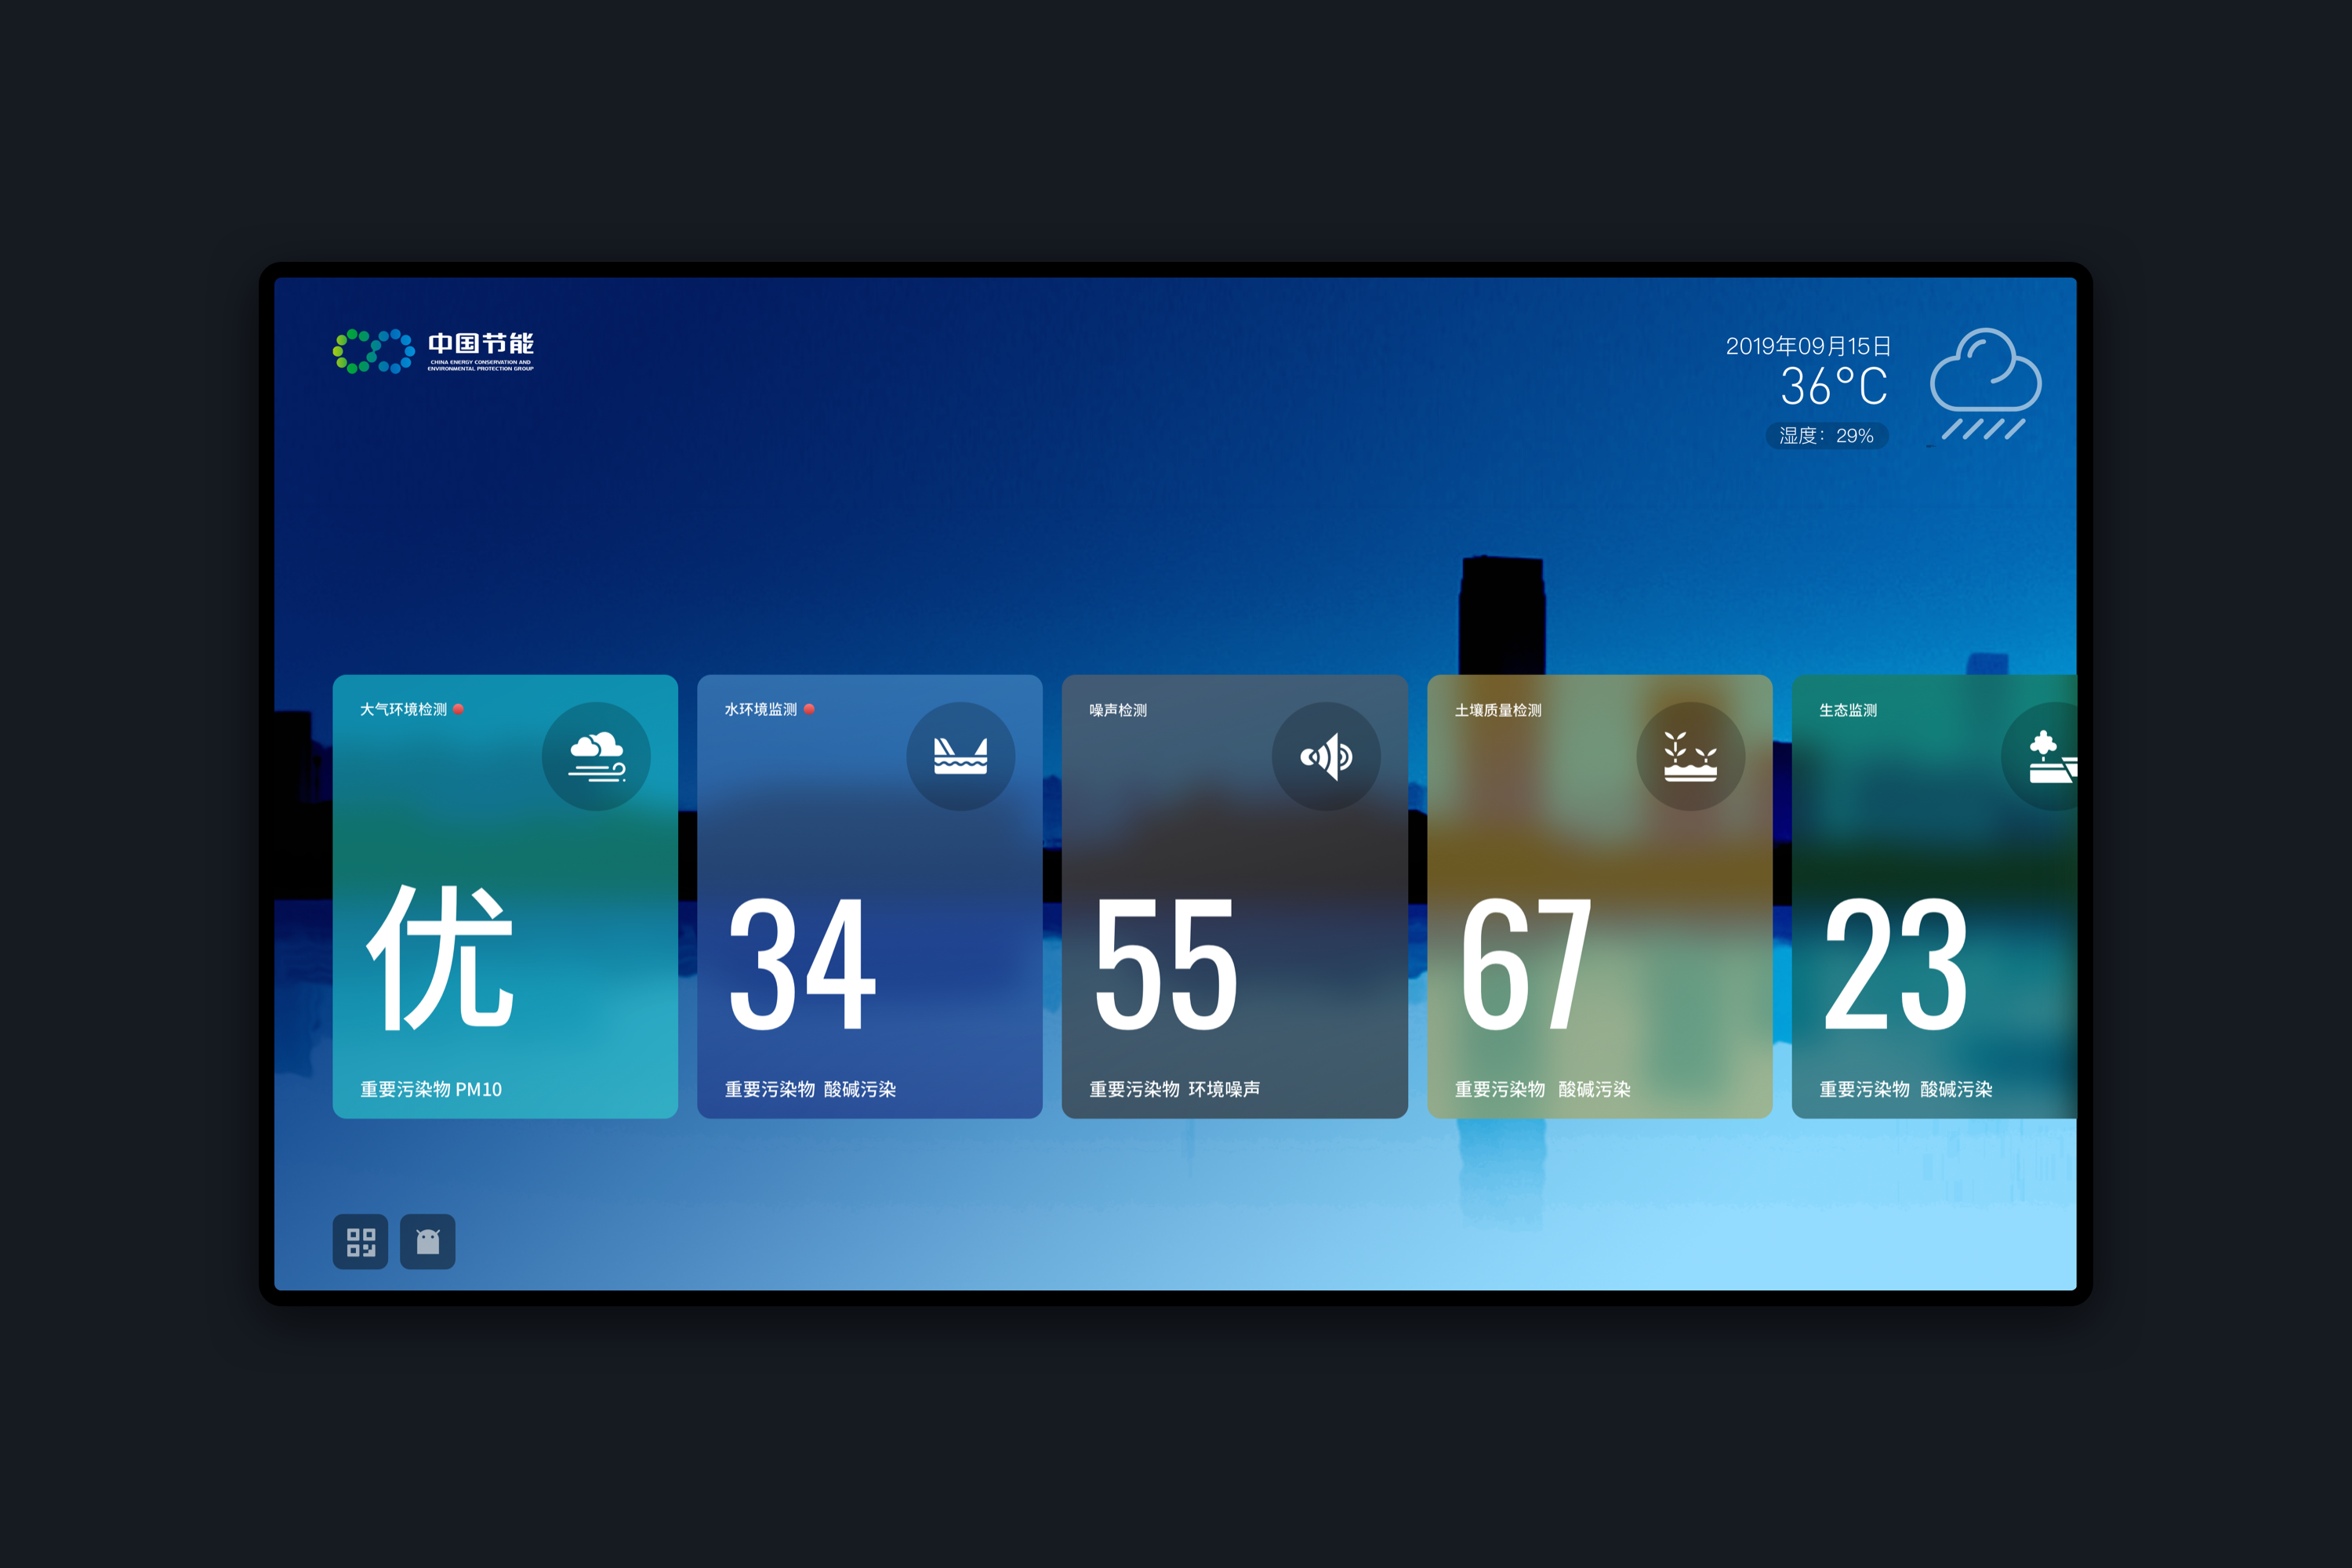
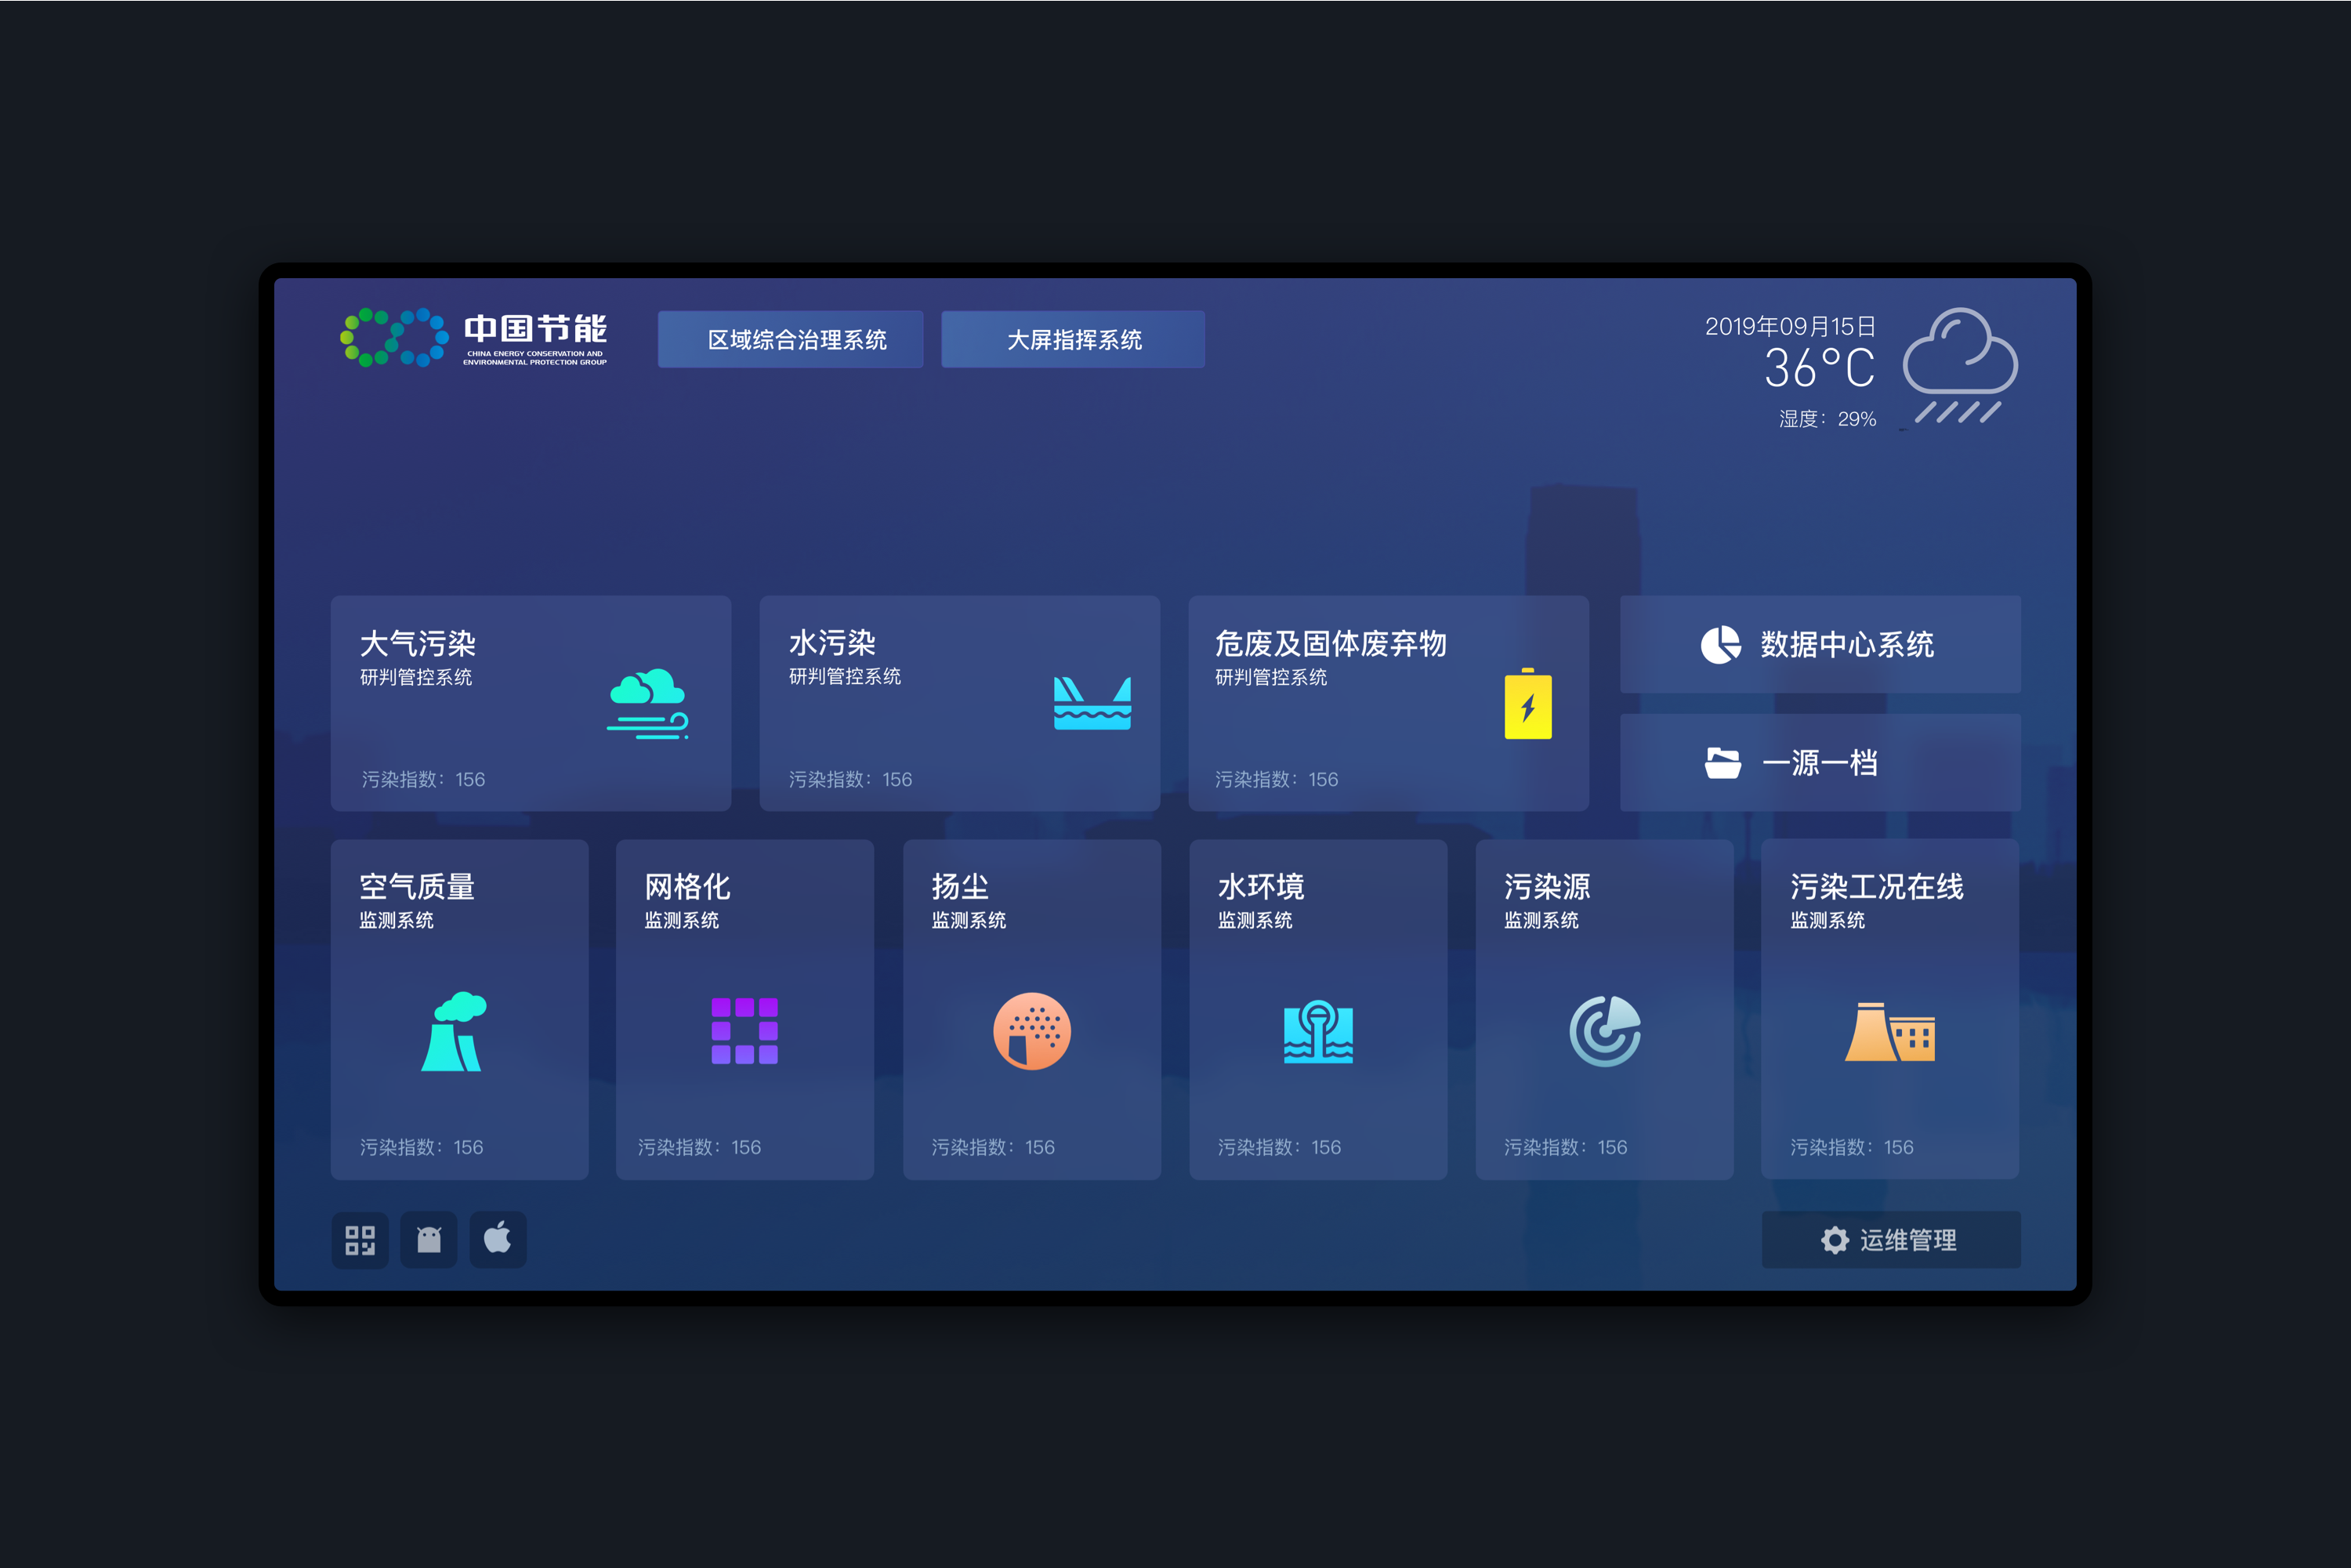
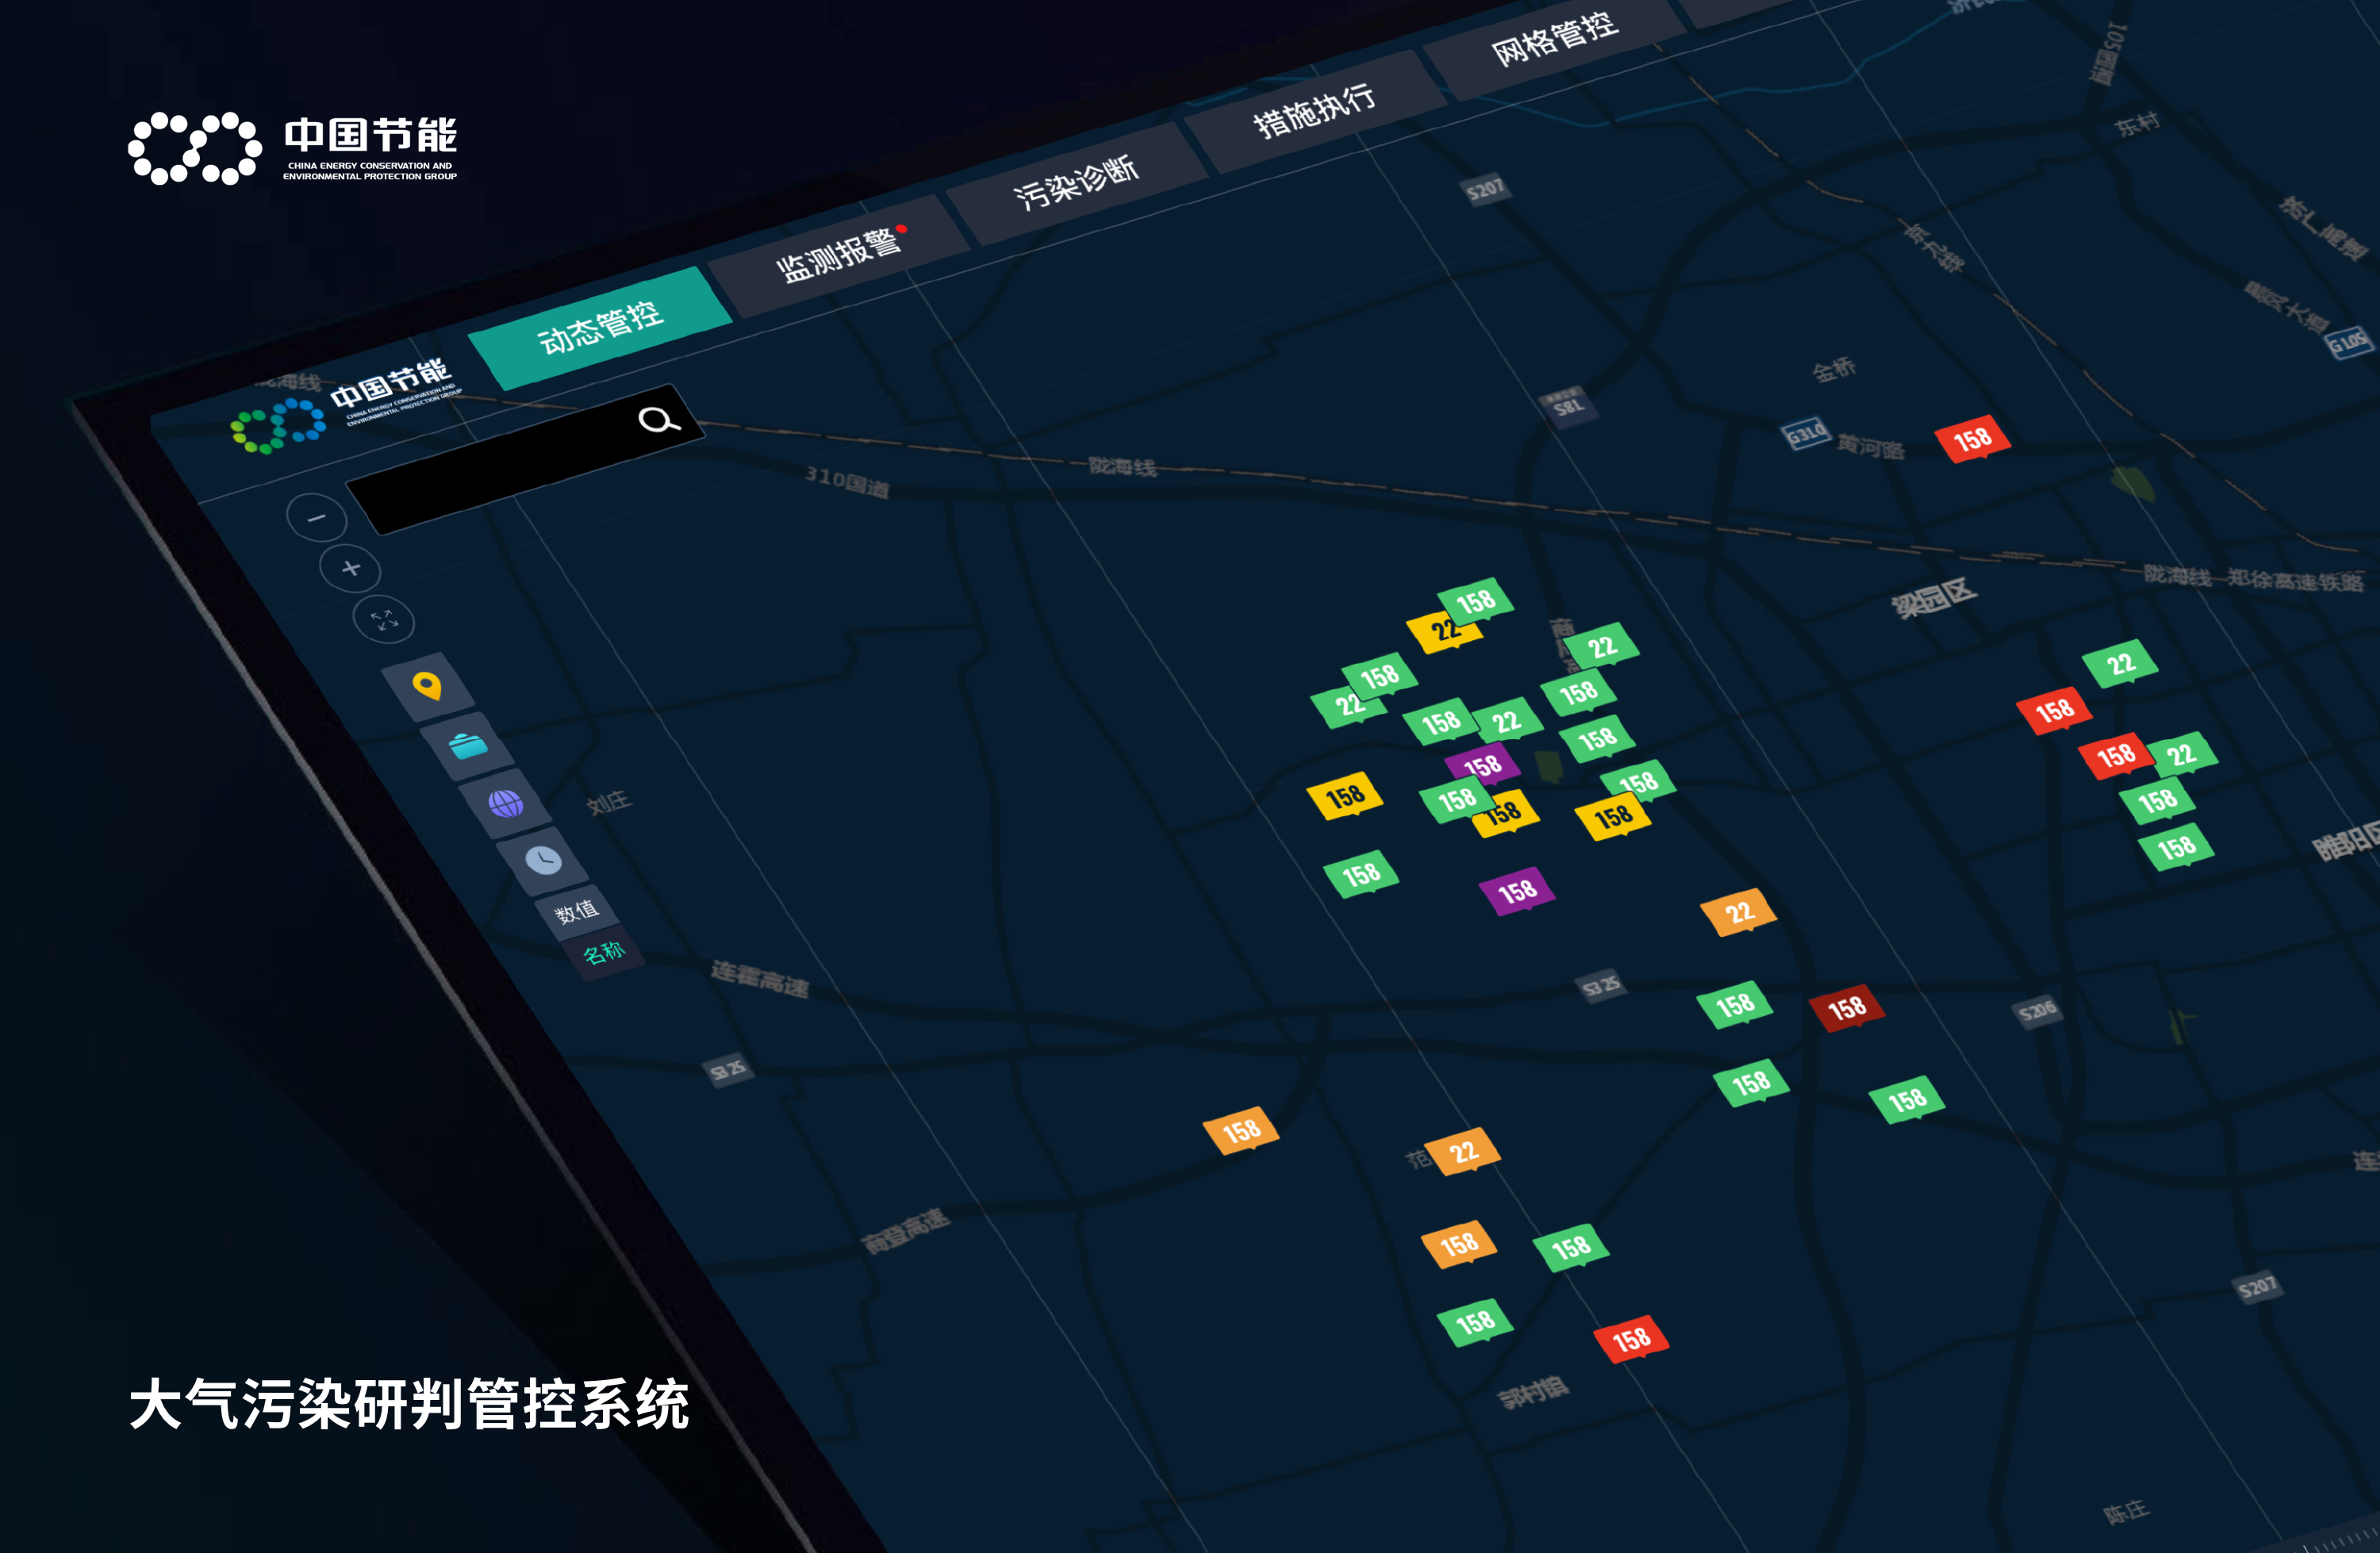
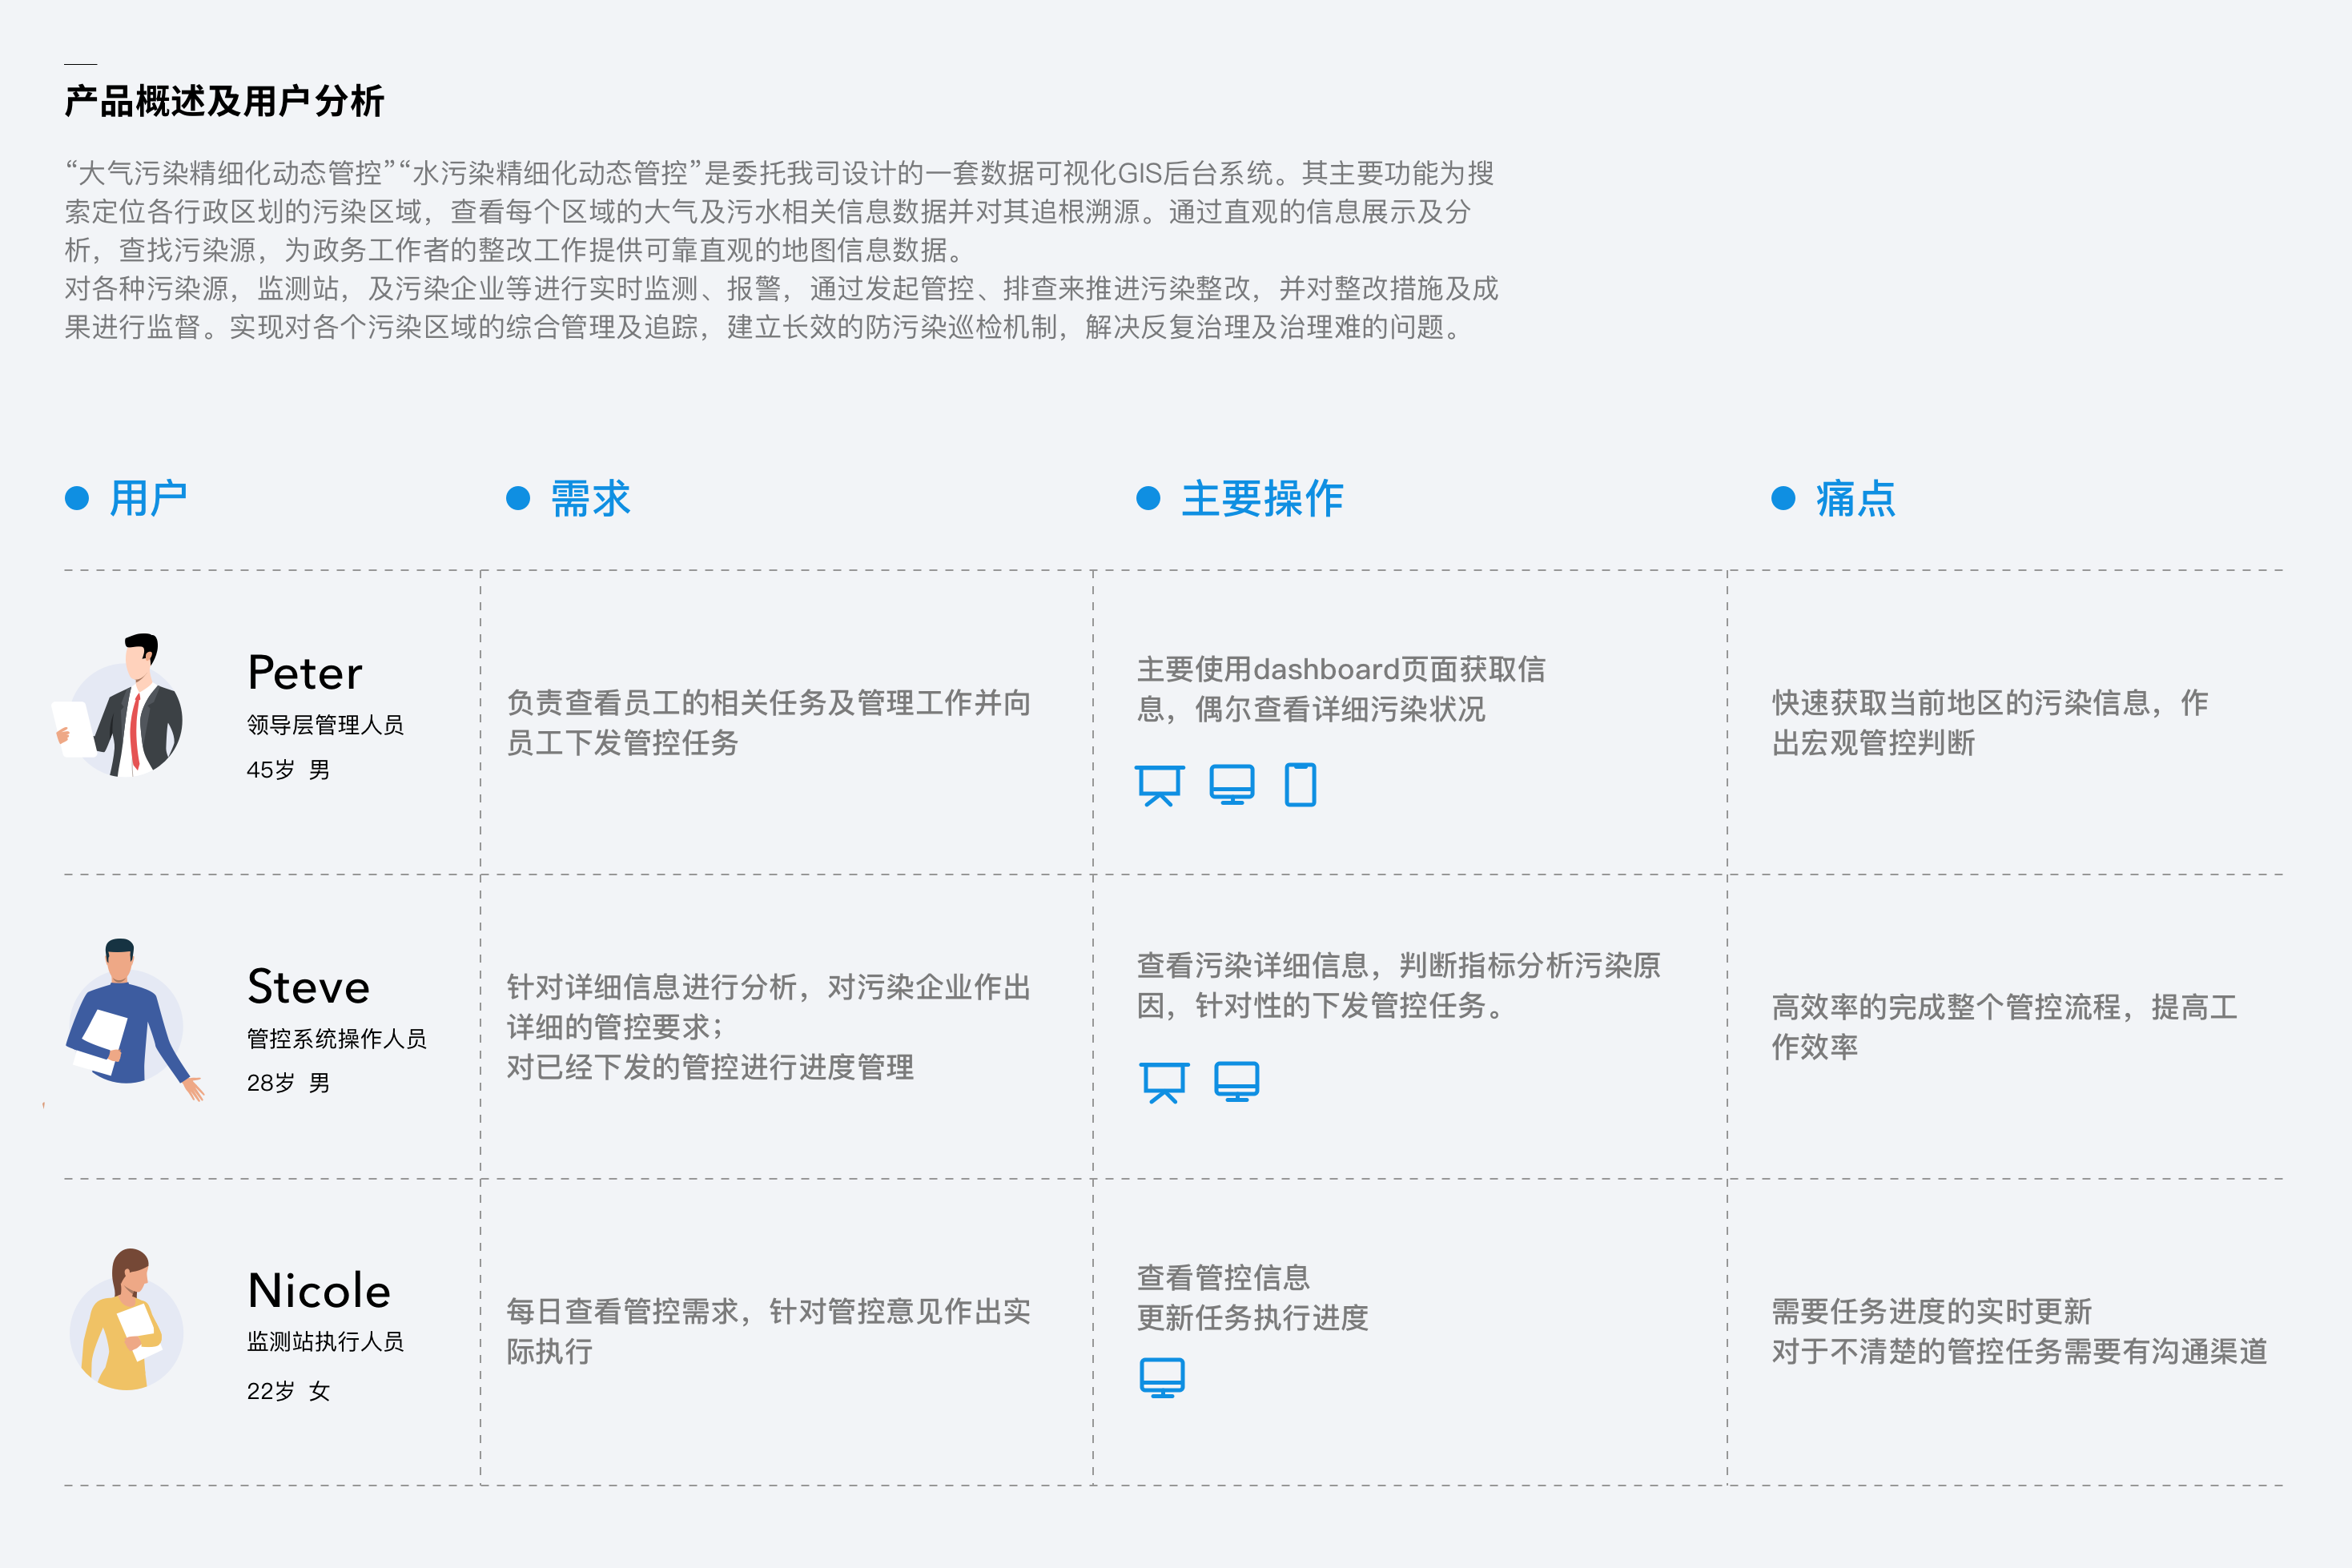
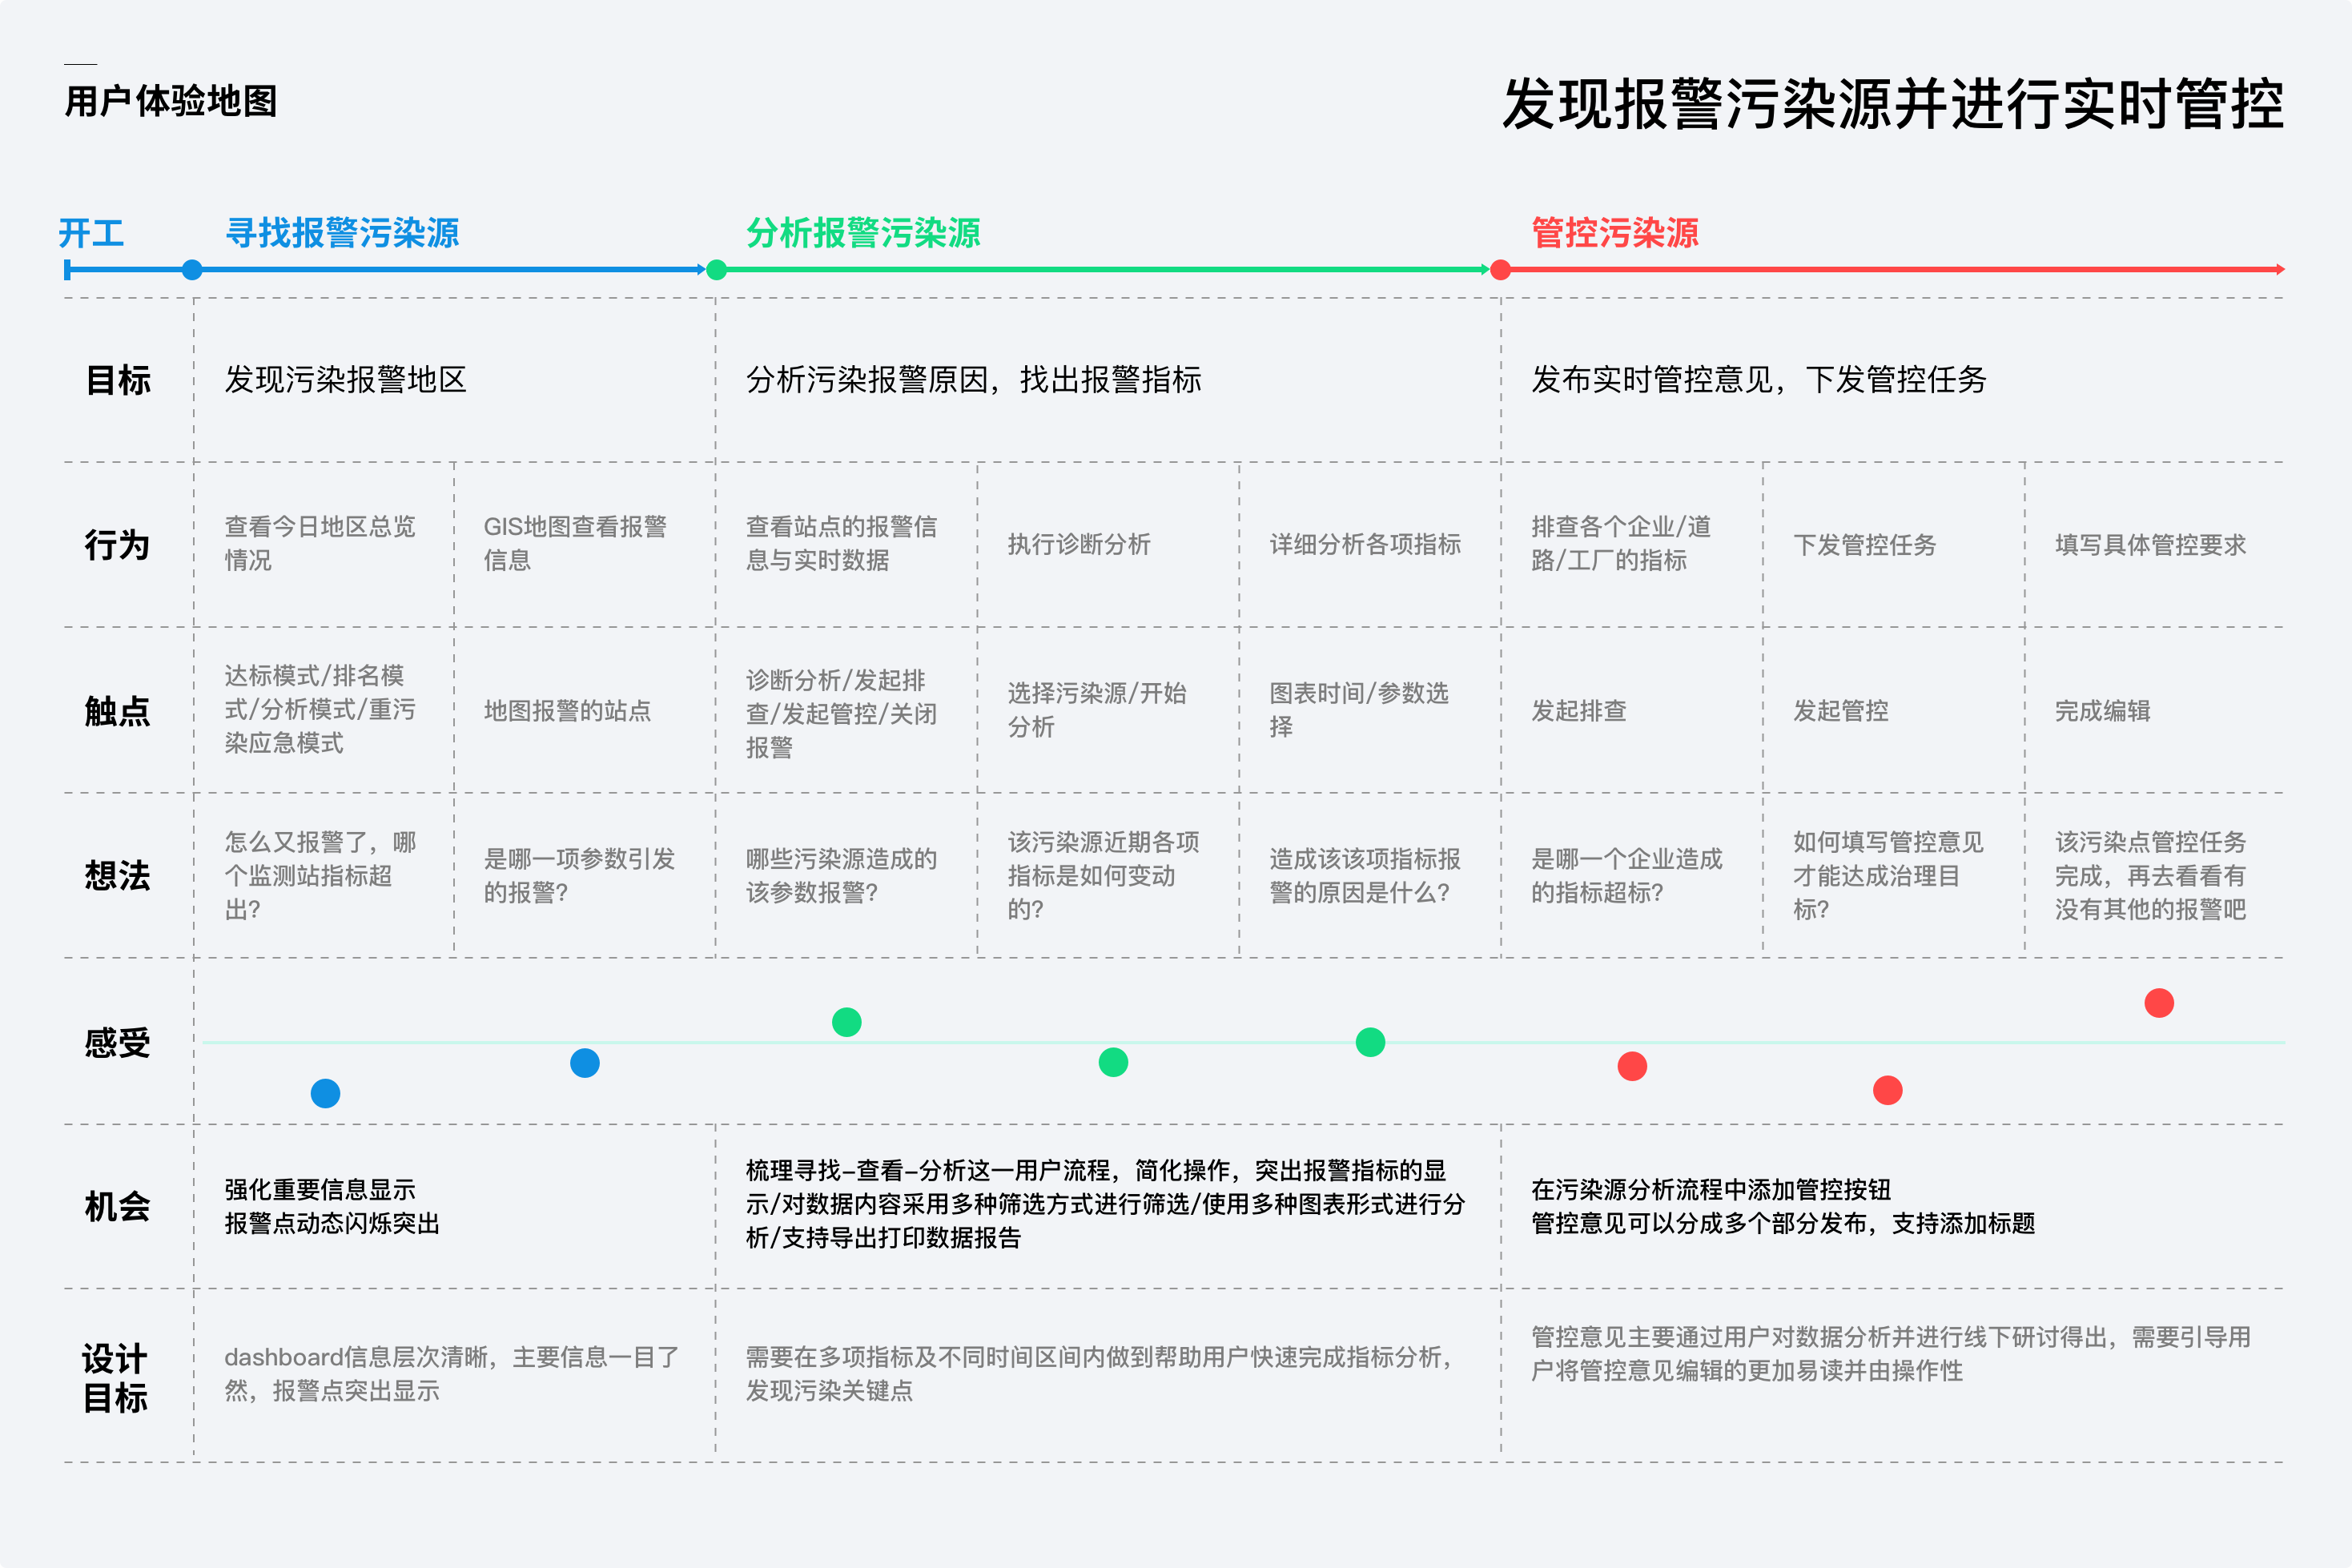
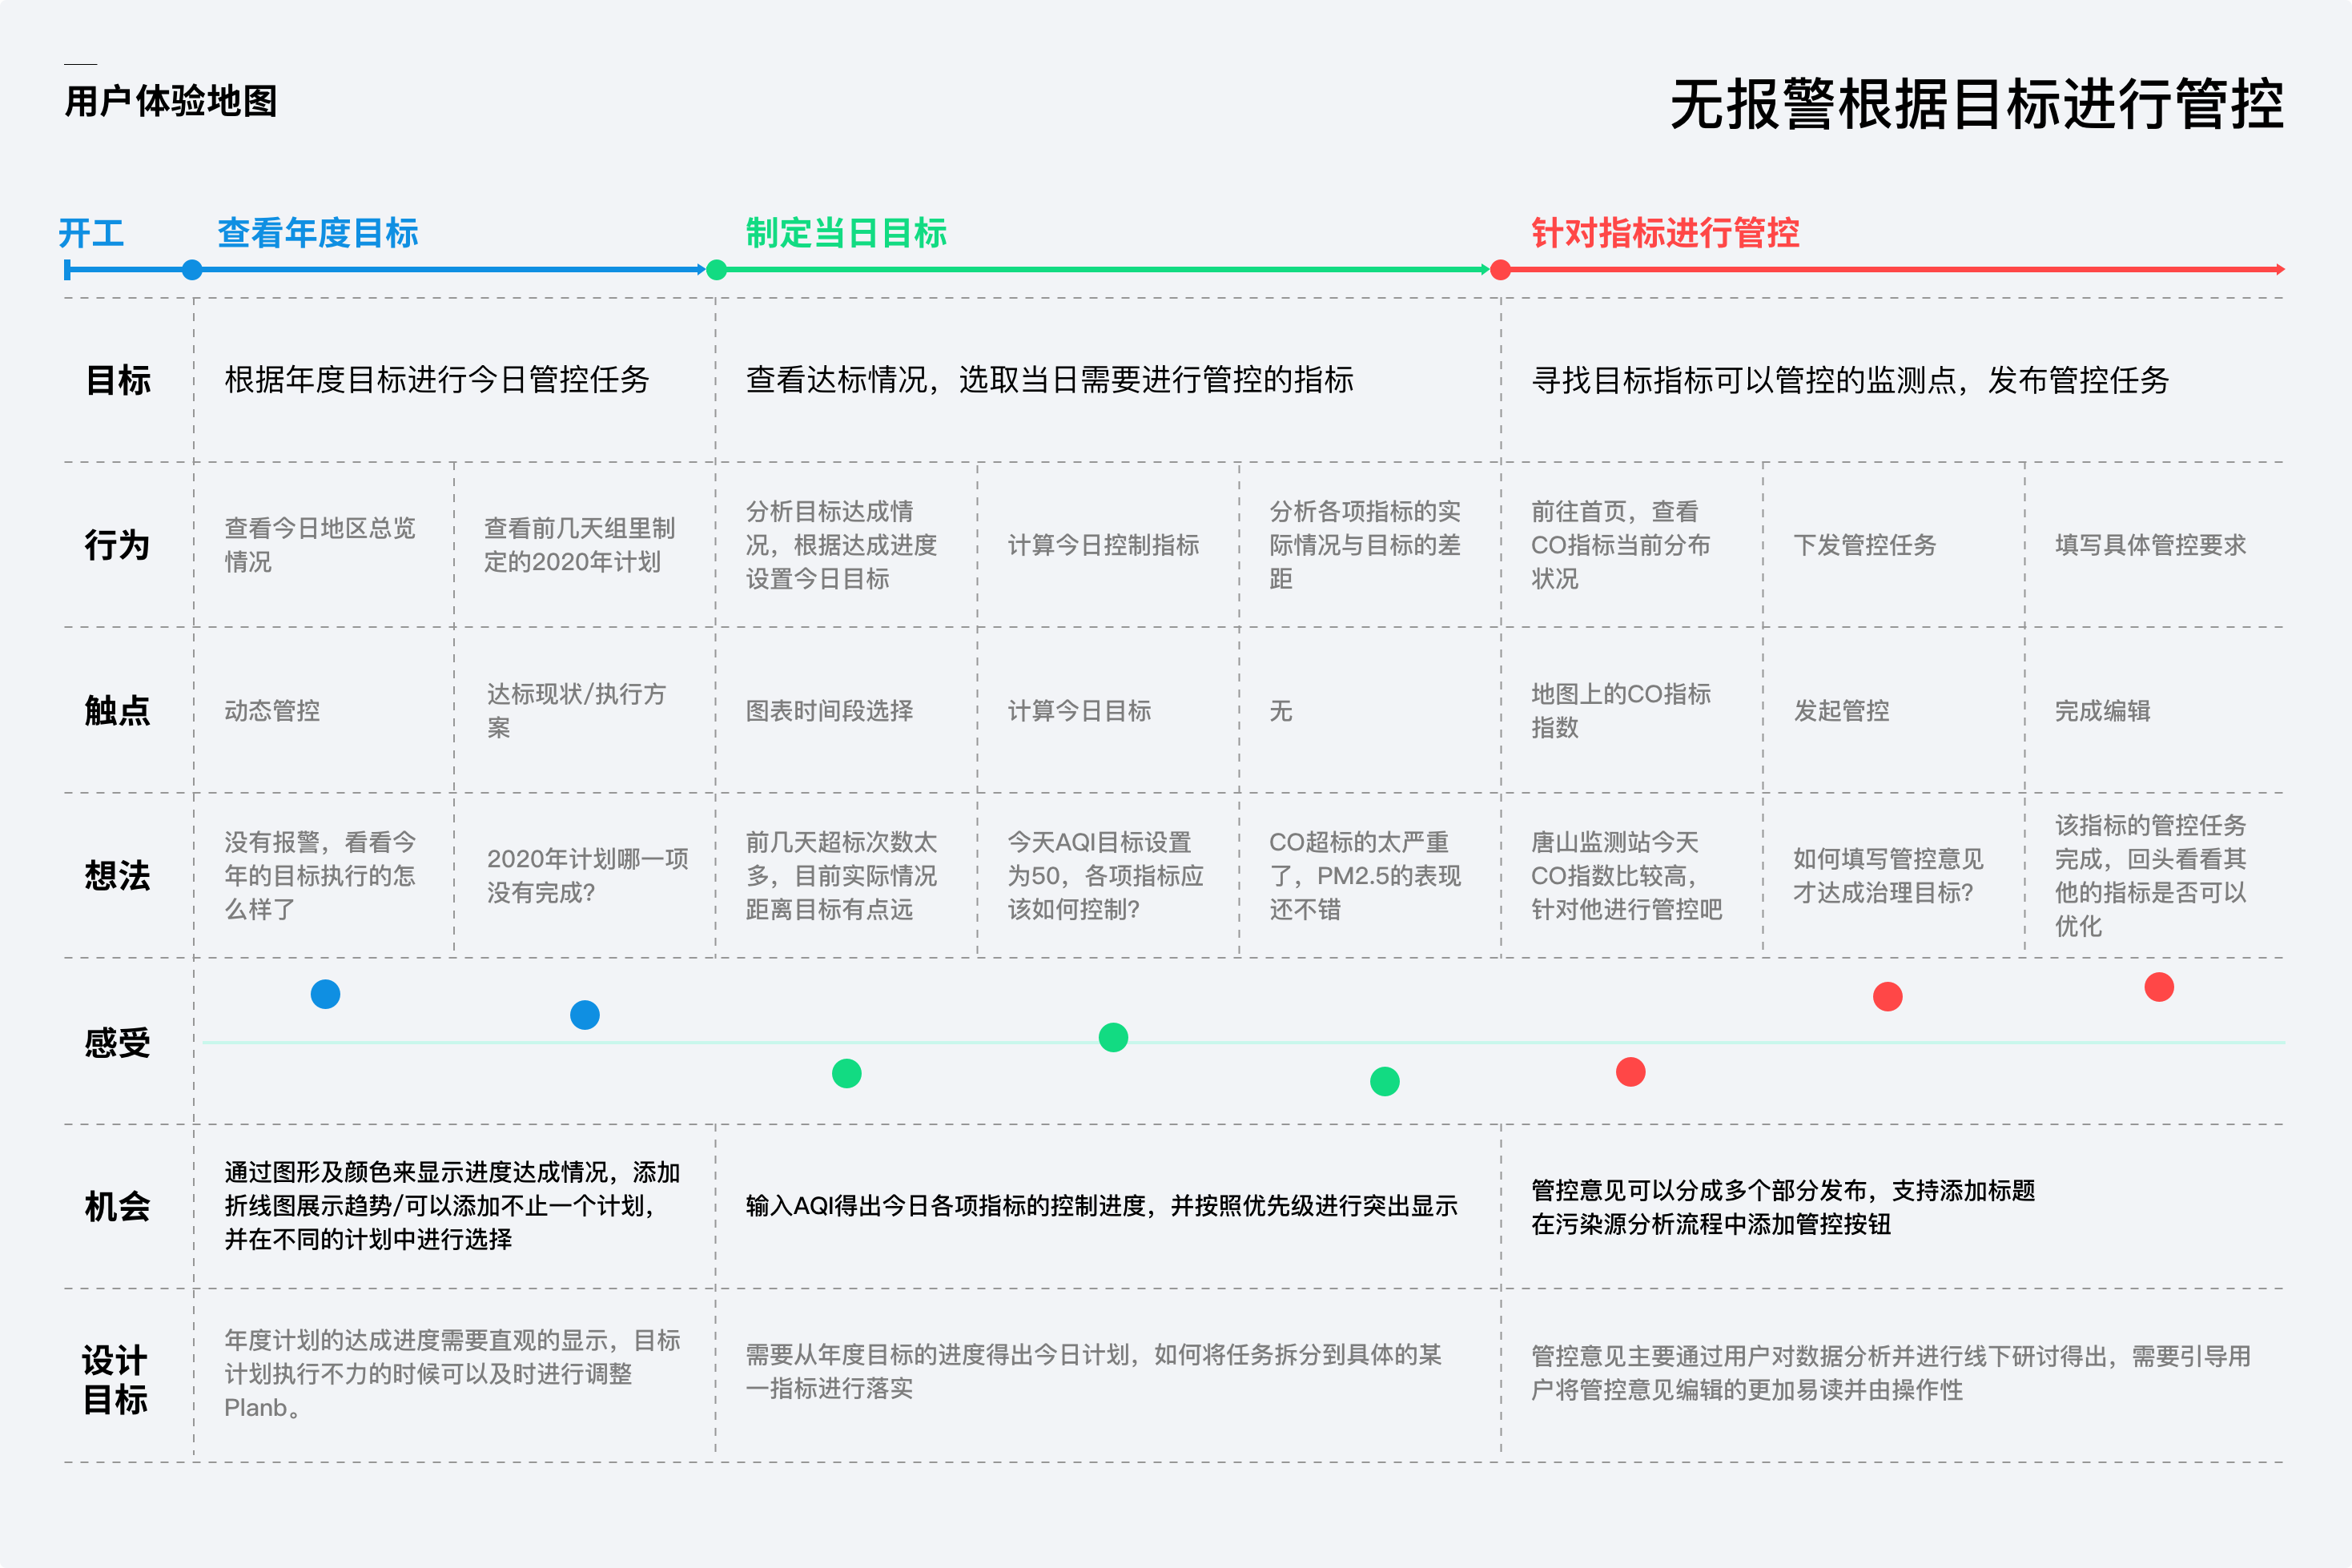
数据可视化界面的设计难点在于如何将复杂且繁多的信息布局排版,以及结合图表使信息呈现的更加简洁直观。在设计上我们使用大量的图标辅助理解,结合污染程度的颜色体系,对大量不同的状态提醒采用冷暖颜色进行标识(是否完成/进行中,是否超标等一系列的状态信息)。

![](https://static.glabcms.stoyard.com/object/20200417/xegy61mb9nq.png)

![](https://static.glabcms.stoyard.com/object/20200417/kthsf2f18y.png)

![](https://static.glabcms.stoyard.com/object/20200417/grg4osikuyi.png)

![](https://static.glabcms.stoyard.com/object/20200417/5sveu7n17do.png)

![](https://static.glabcms.stoyard.com/object/20200417/6dmbudbyu7k.png)

![](https://static.glabcms.stoyard.com/object/20200417/ay26wvoegsa.png)

![](https://static.glabcms.stoyard.com/object/20200418/mwcijrjtt5b.png)

![](https://static.glabcms.stoyard.com/object/20200418/mppnjixybc.png)

![](https://static.glabcms.stoyard.com/object/20200418/5vf5h18aqvu.png)

![](https://static.glabcms.stoyard.com/object/20200418/lqi1f2qkgli.png)

![](https://static.glabcms.stoyard.com/object/20200417/xnpk6a1akgg.png)

![](https://static.glabcms.stoyard.com/object/20200417/v7bnzjel9j.png)

![](https://static.glabcms.stoyard.com/object/20200417/c3e4axstsnj.png)

![](https://static.glabcms.stoyard.com/object/20200417/h28baag68y.png)

![](https://static.glabcms.stoyard.com/object/20200417/im7qqea2d4i.png)

![](https://static.glabcms.stoyard.com/object/20200418/37zse04dj7y.png)

![](https://static.glabcms.stoyard.com/object/20200418/v9t1ldmpao.png)

![](https://static.glabcms.stoyard.com/object/20200418/2ukopiihb75.png)

![](https://static.glabcms.stoyard.com/object/20200418/bwsv45uo5tm.png)

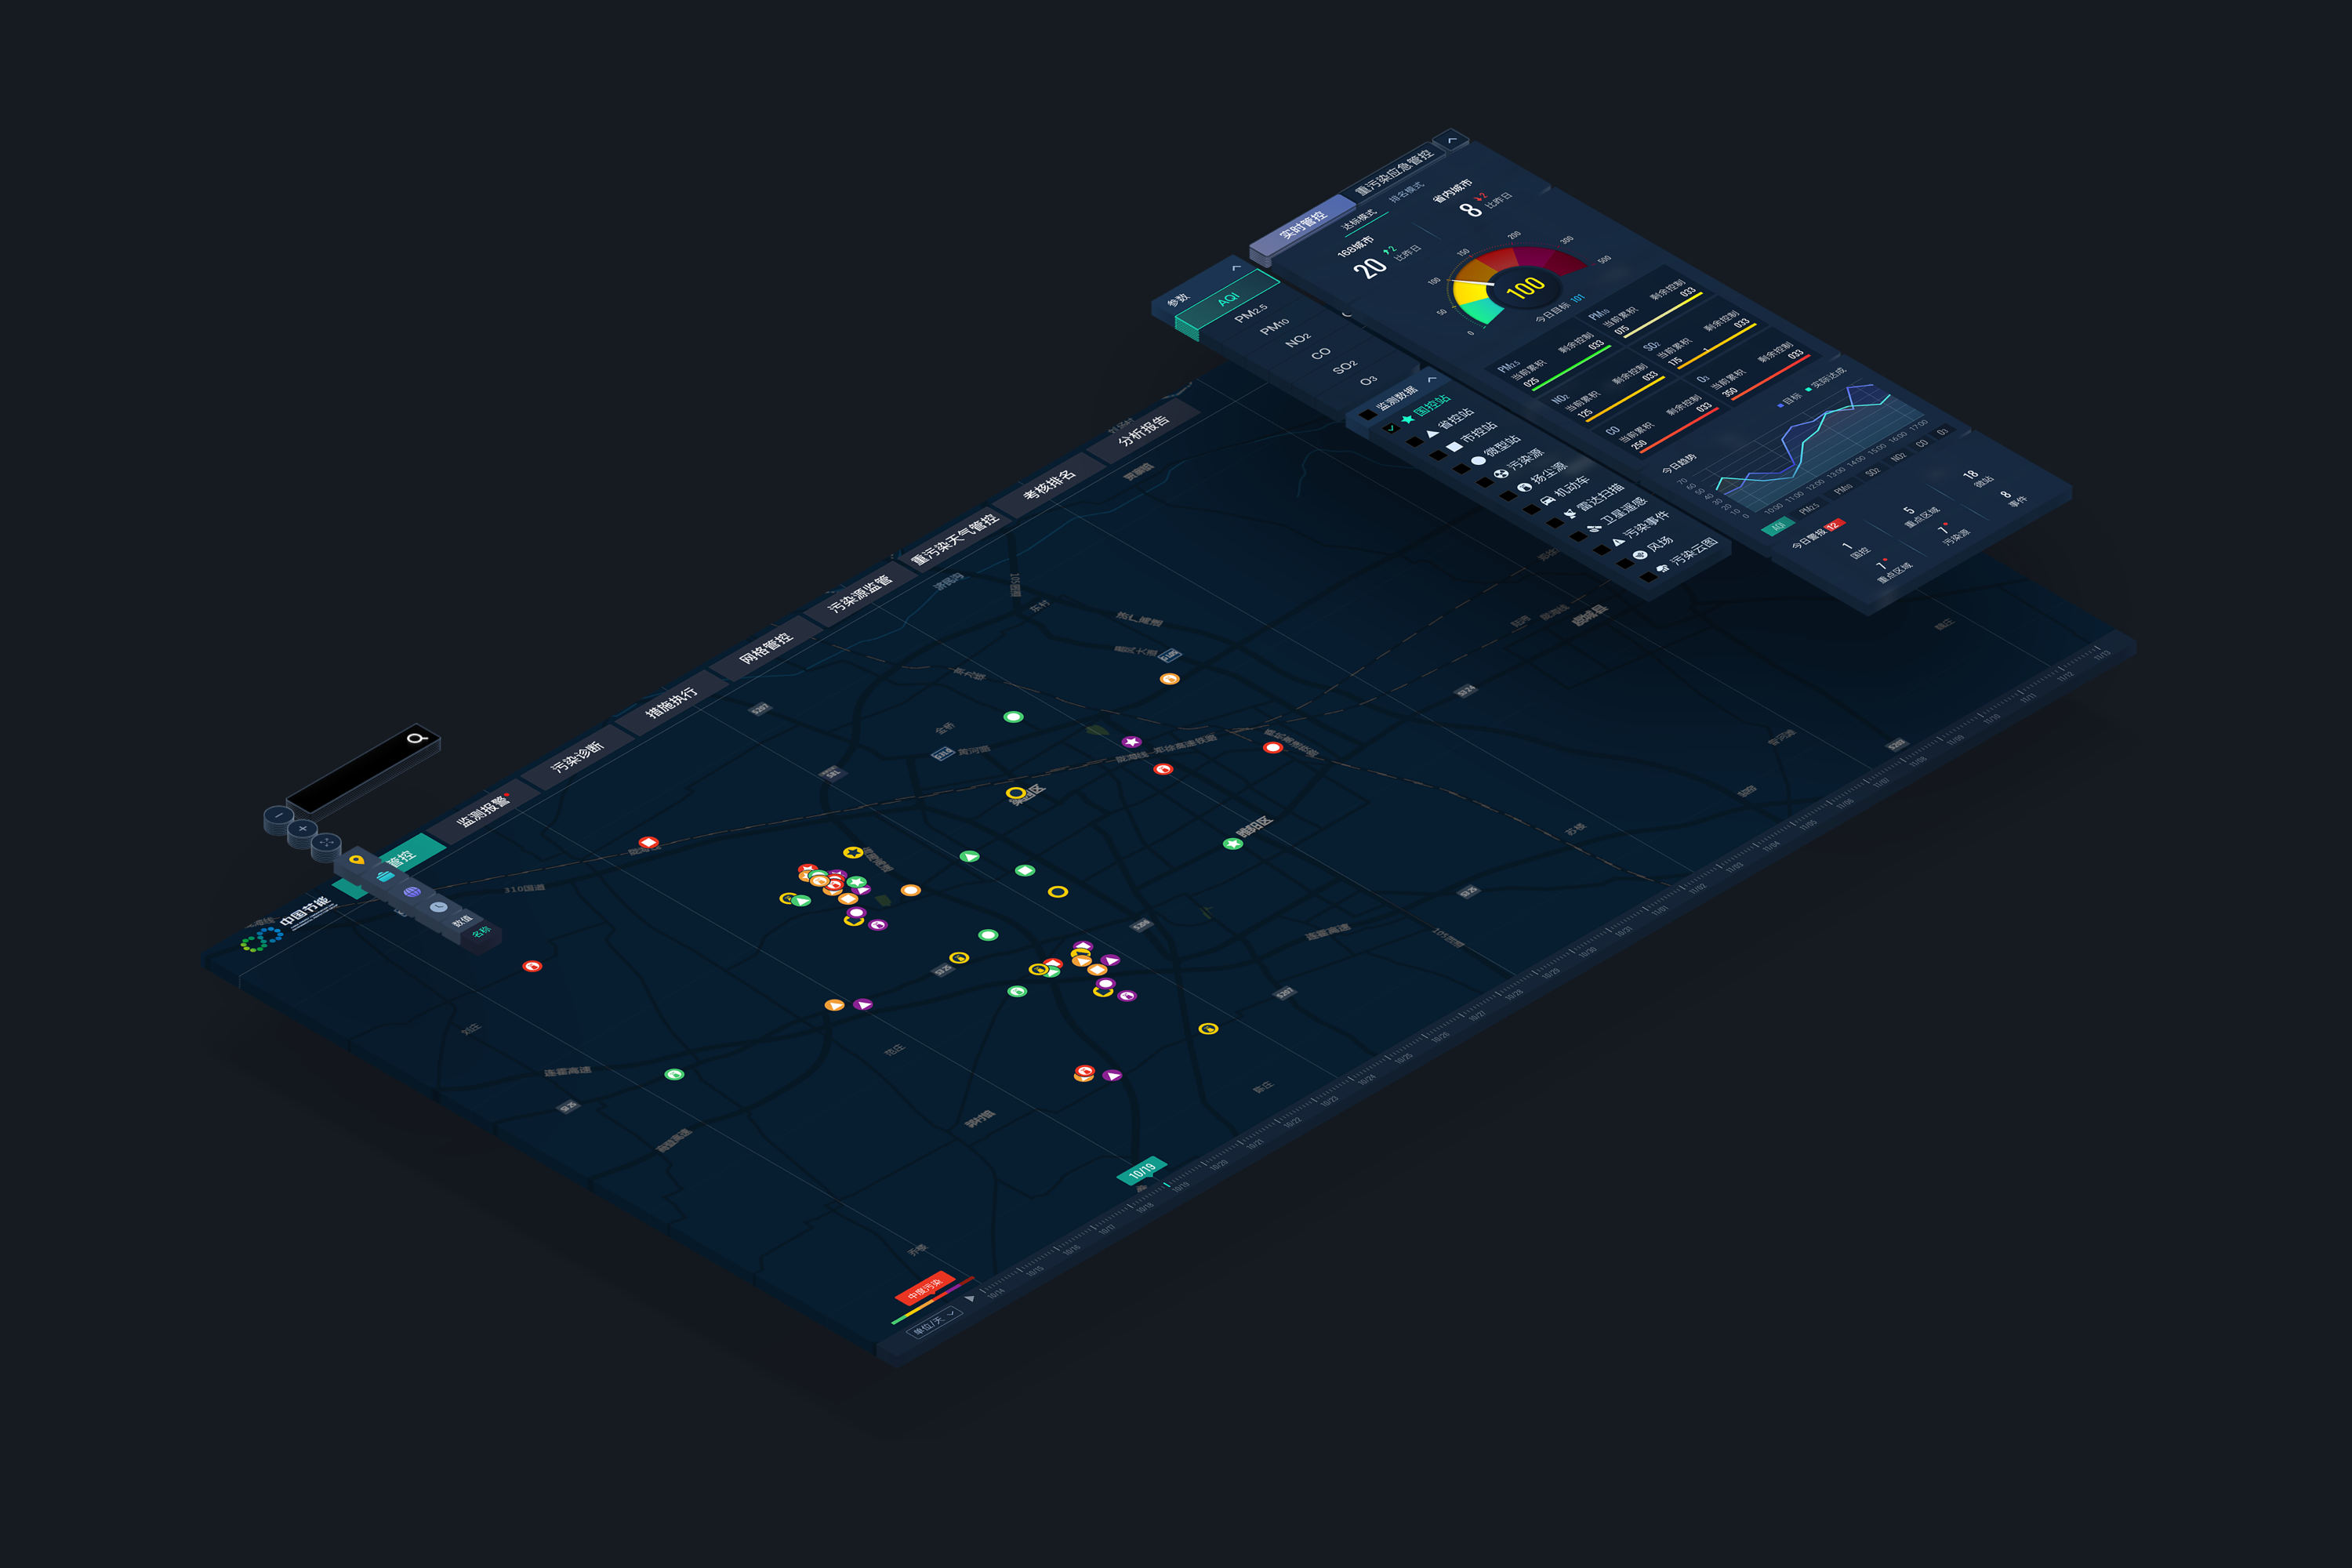
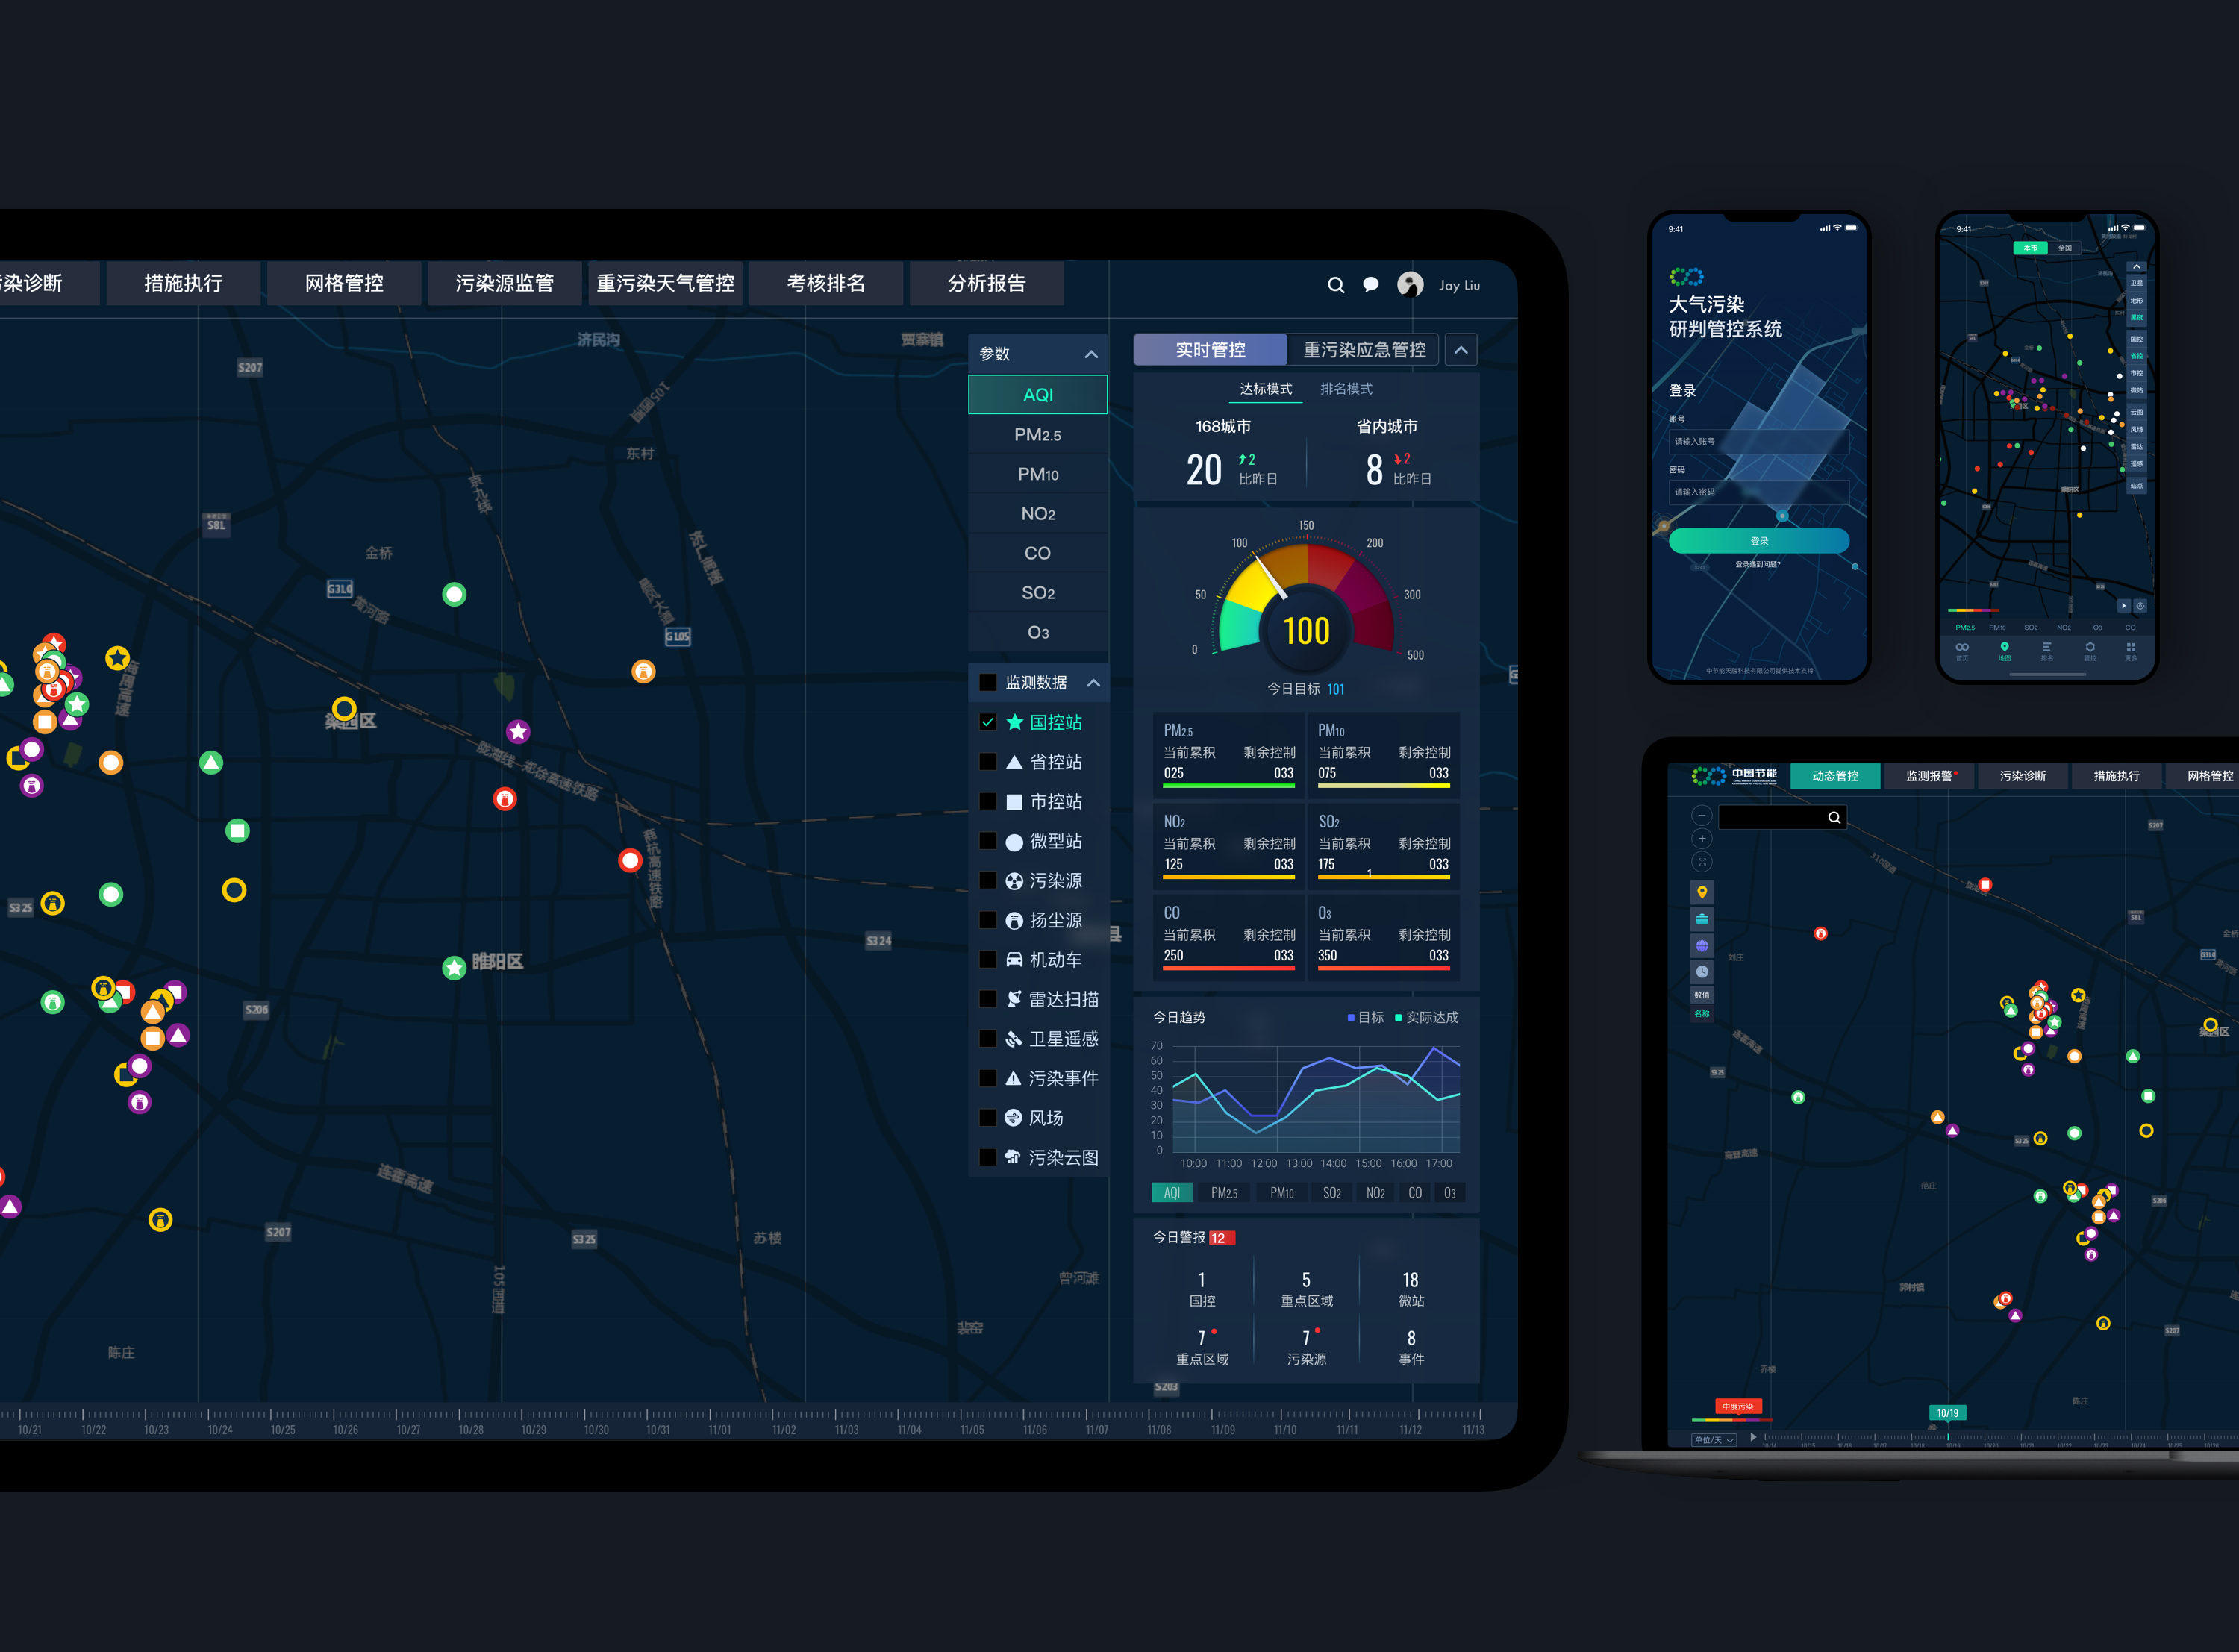
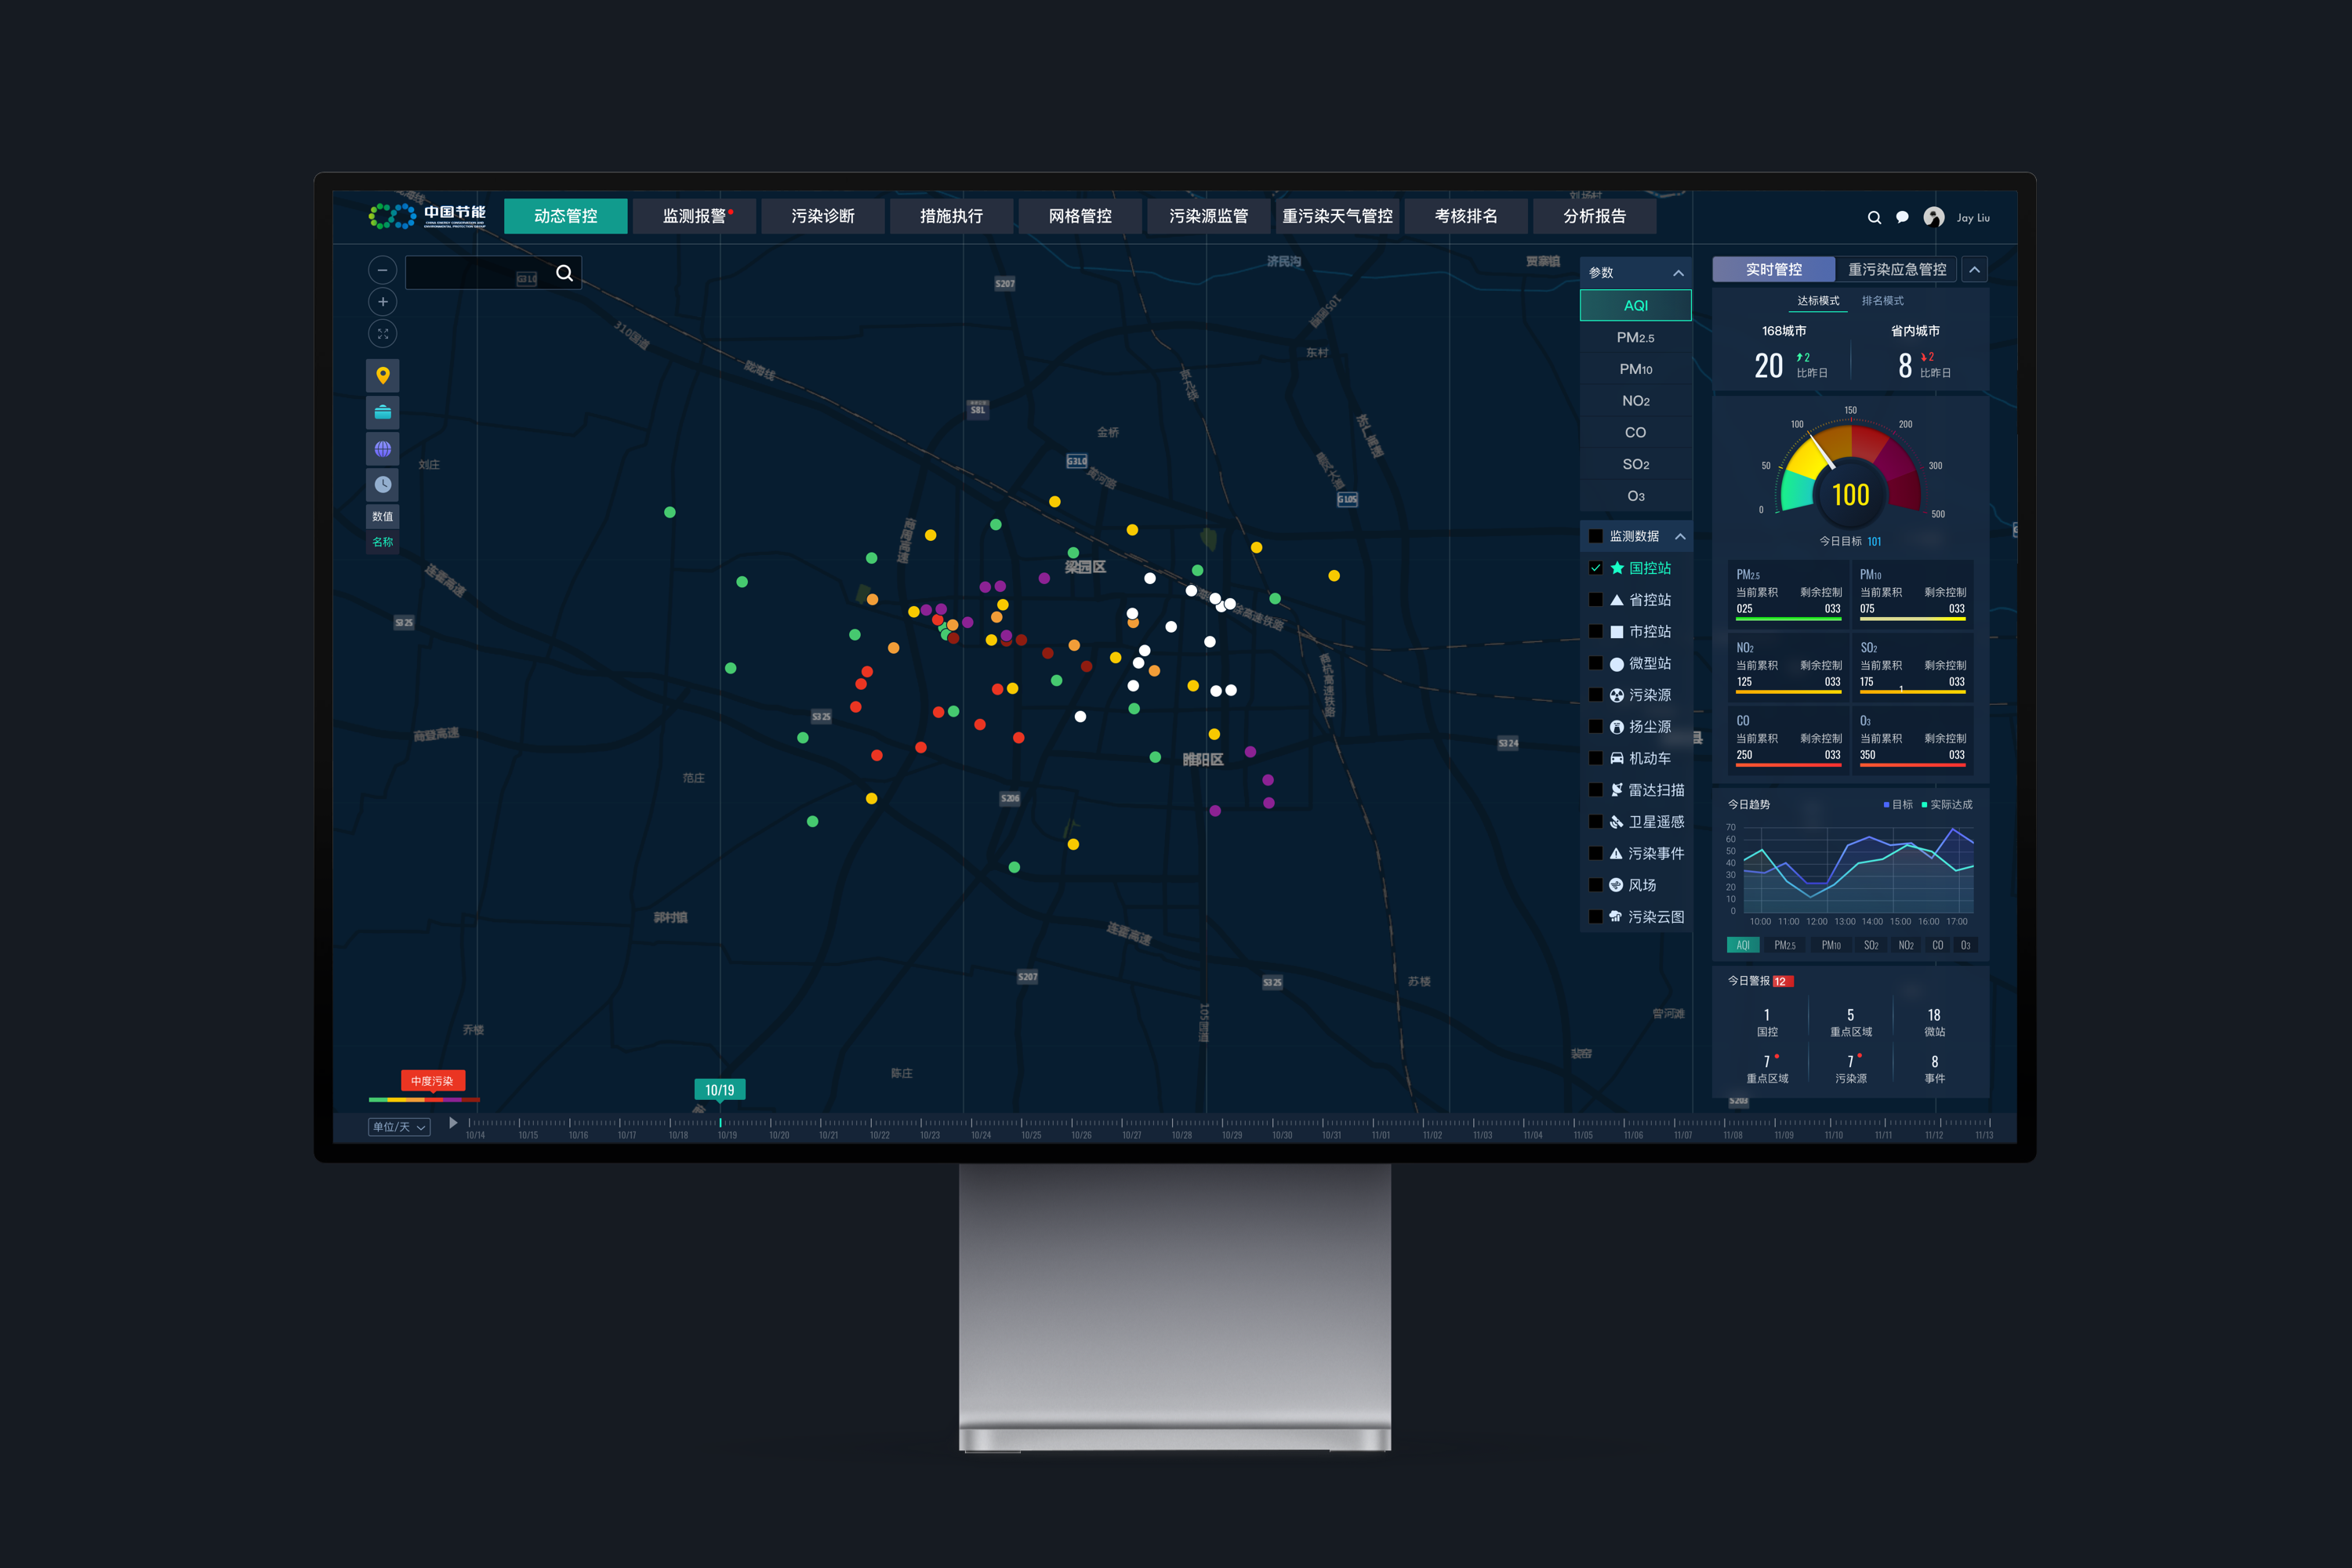
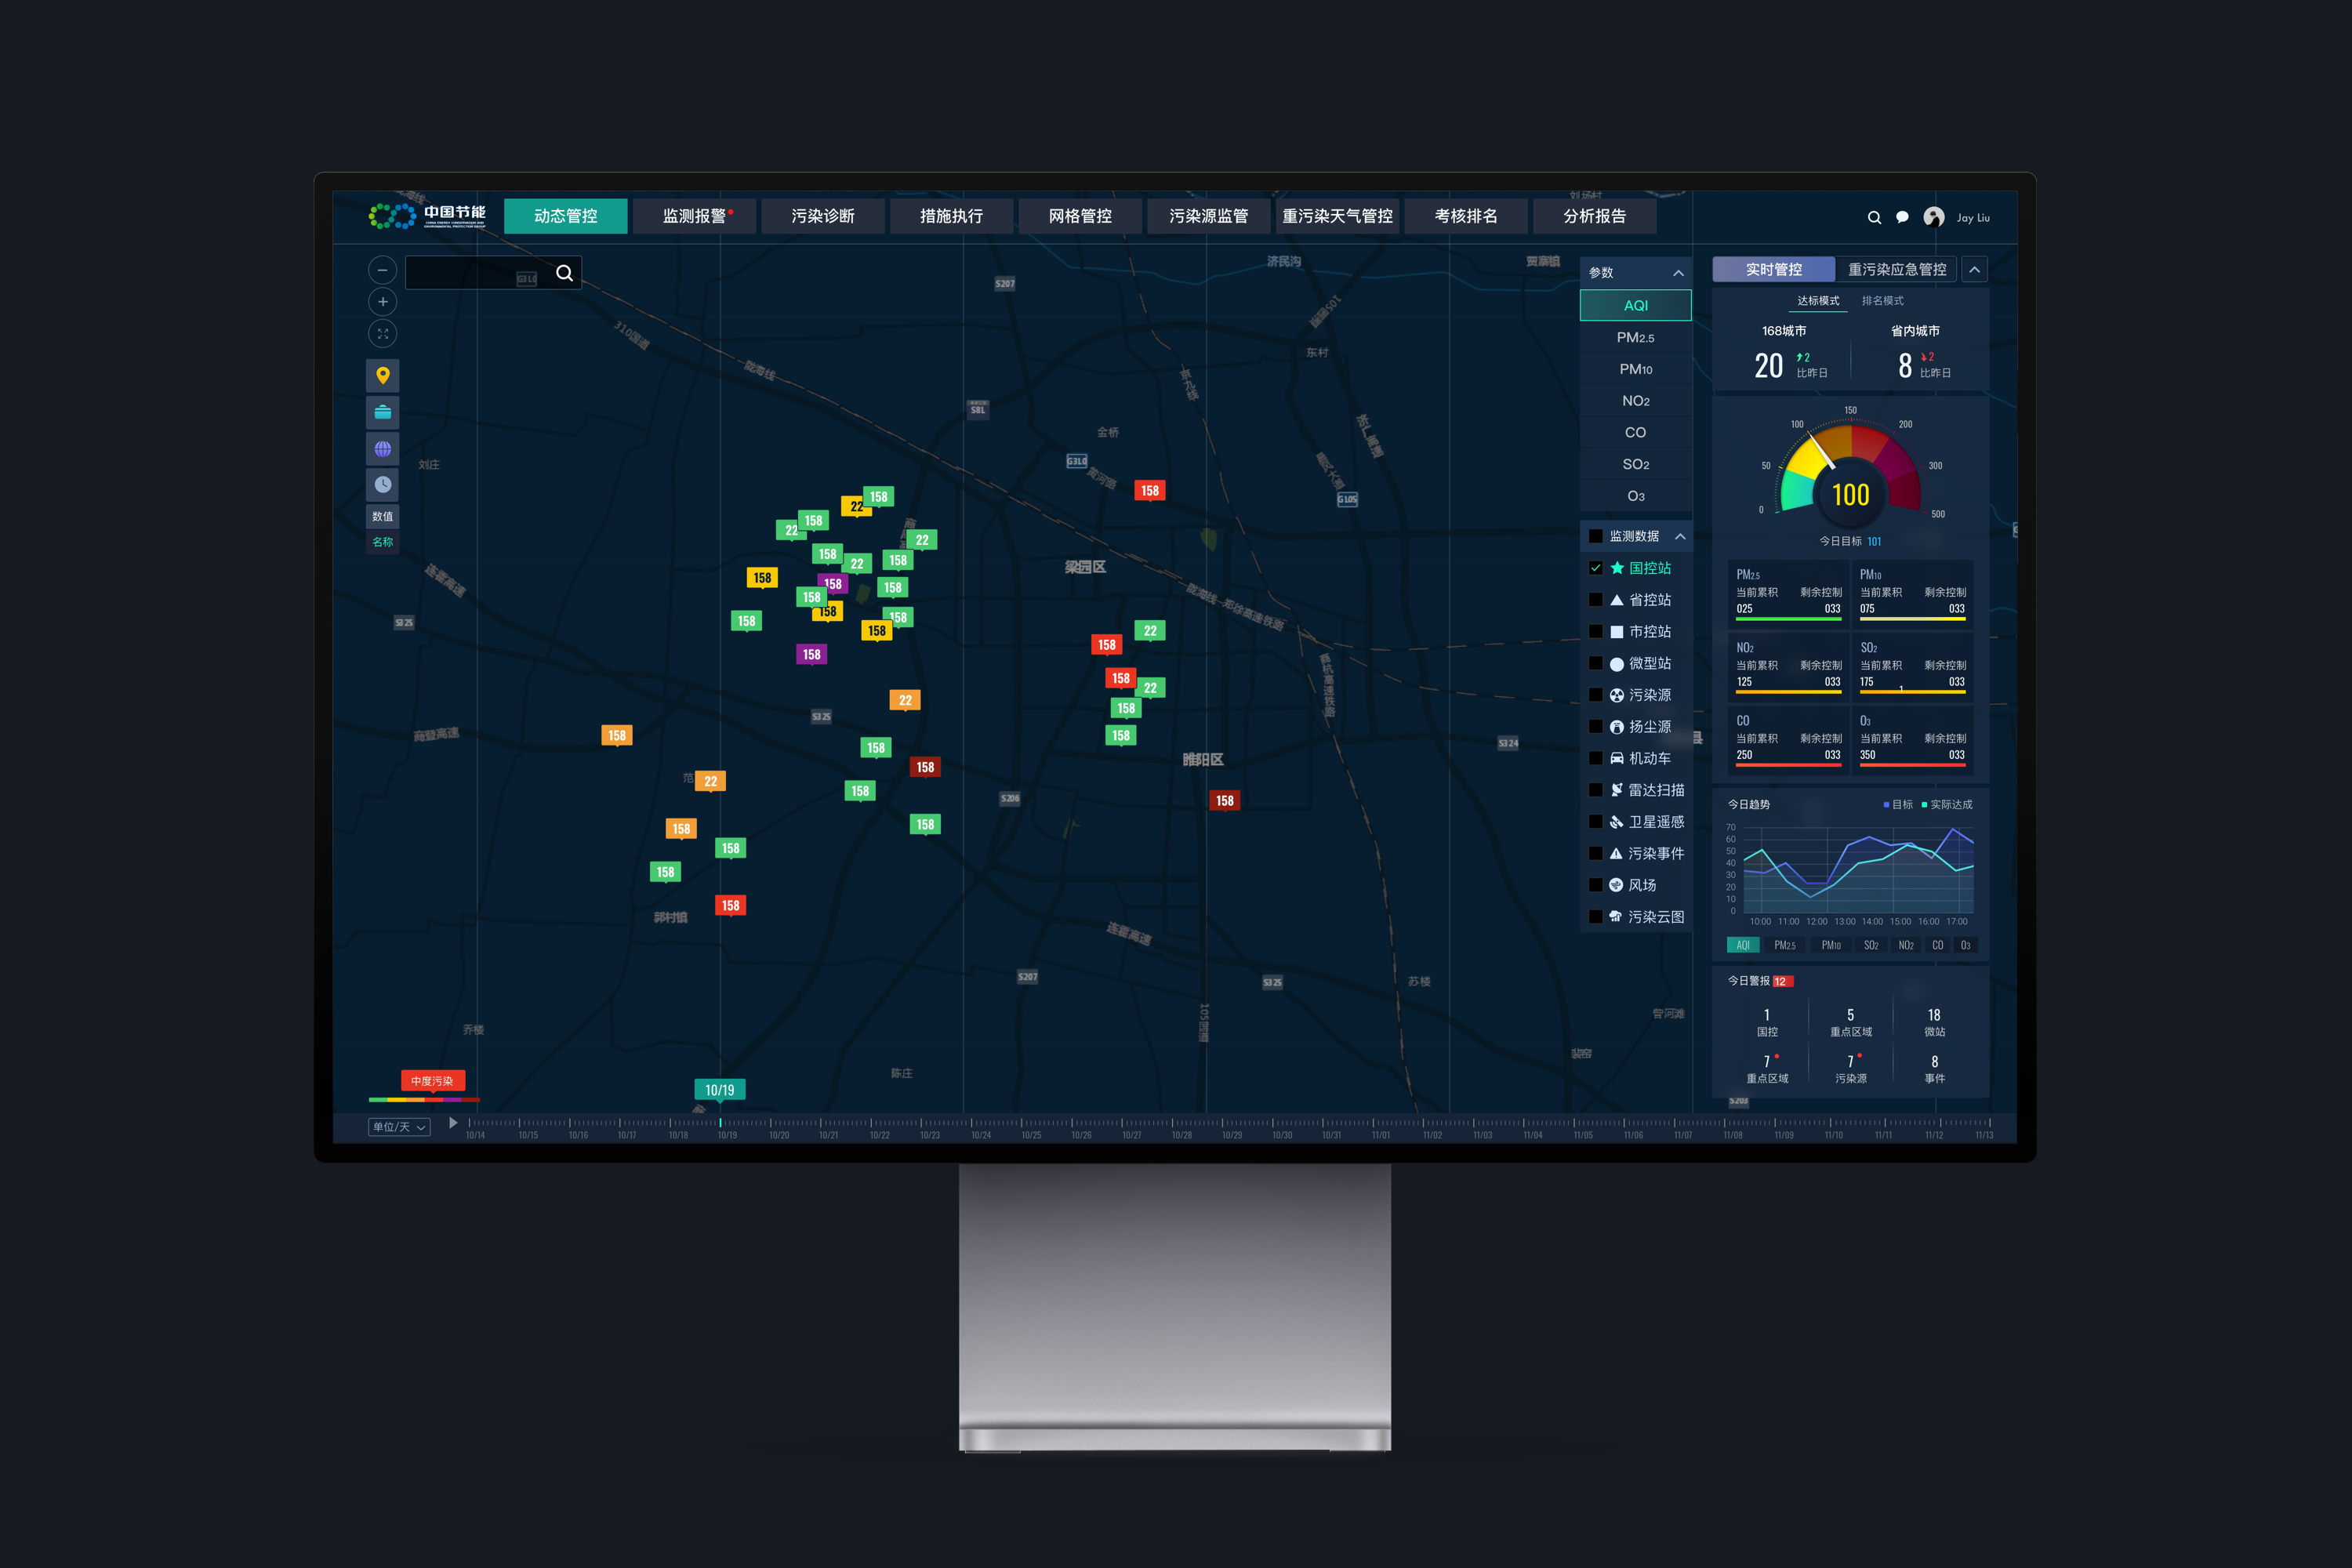
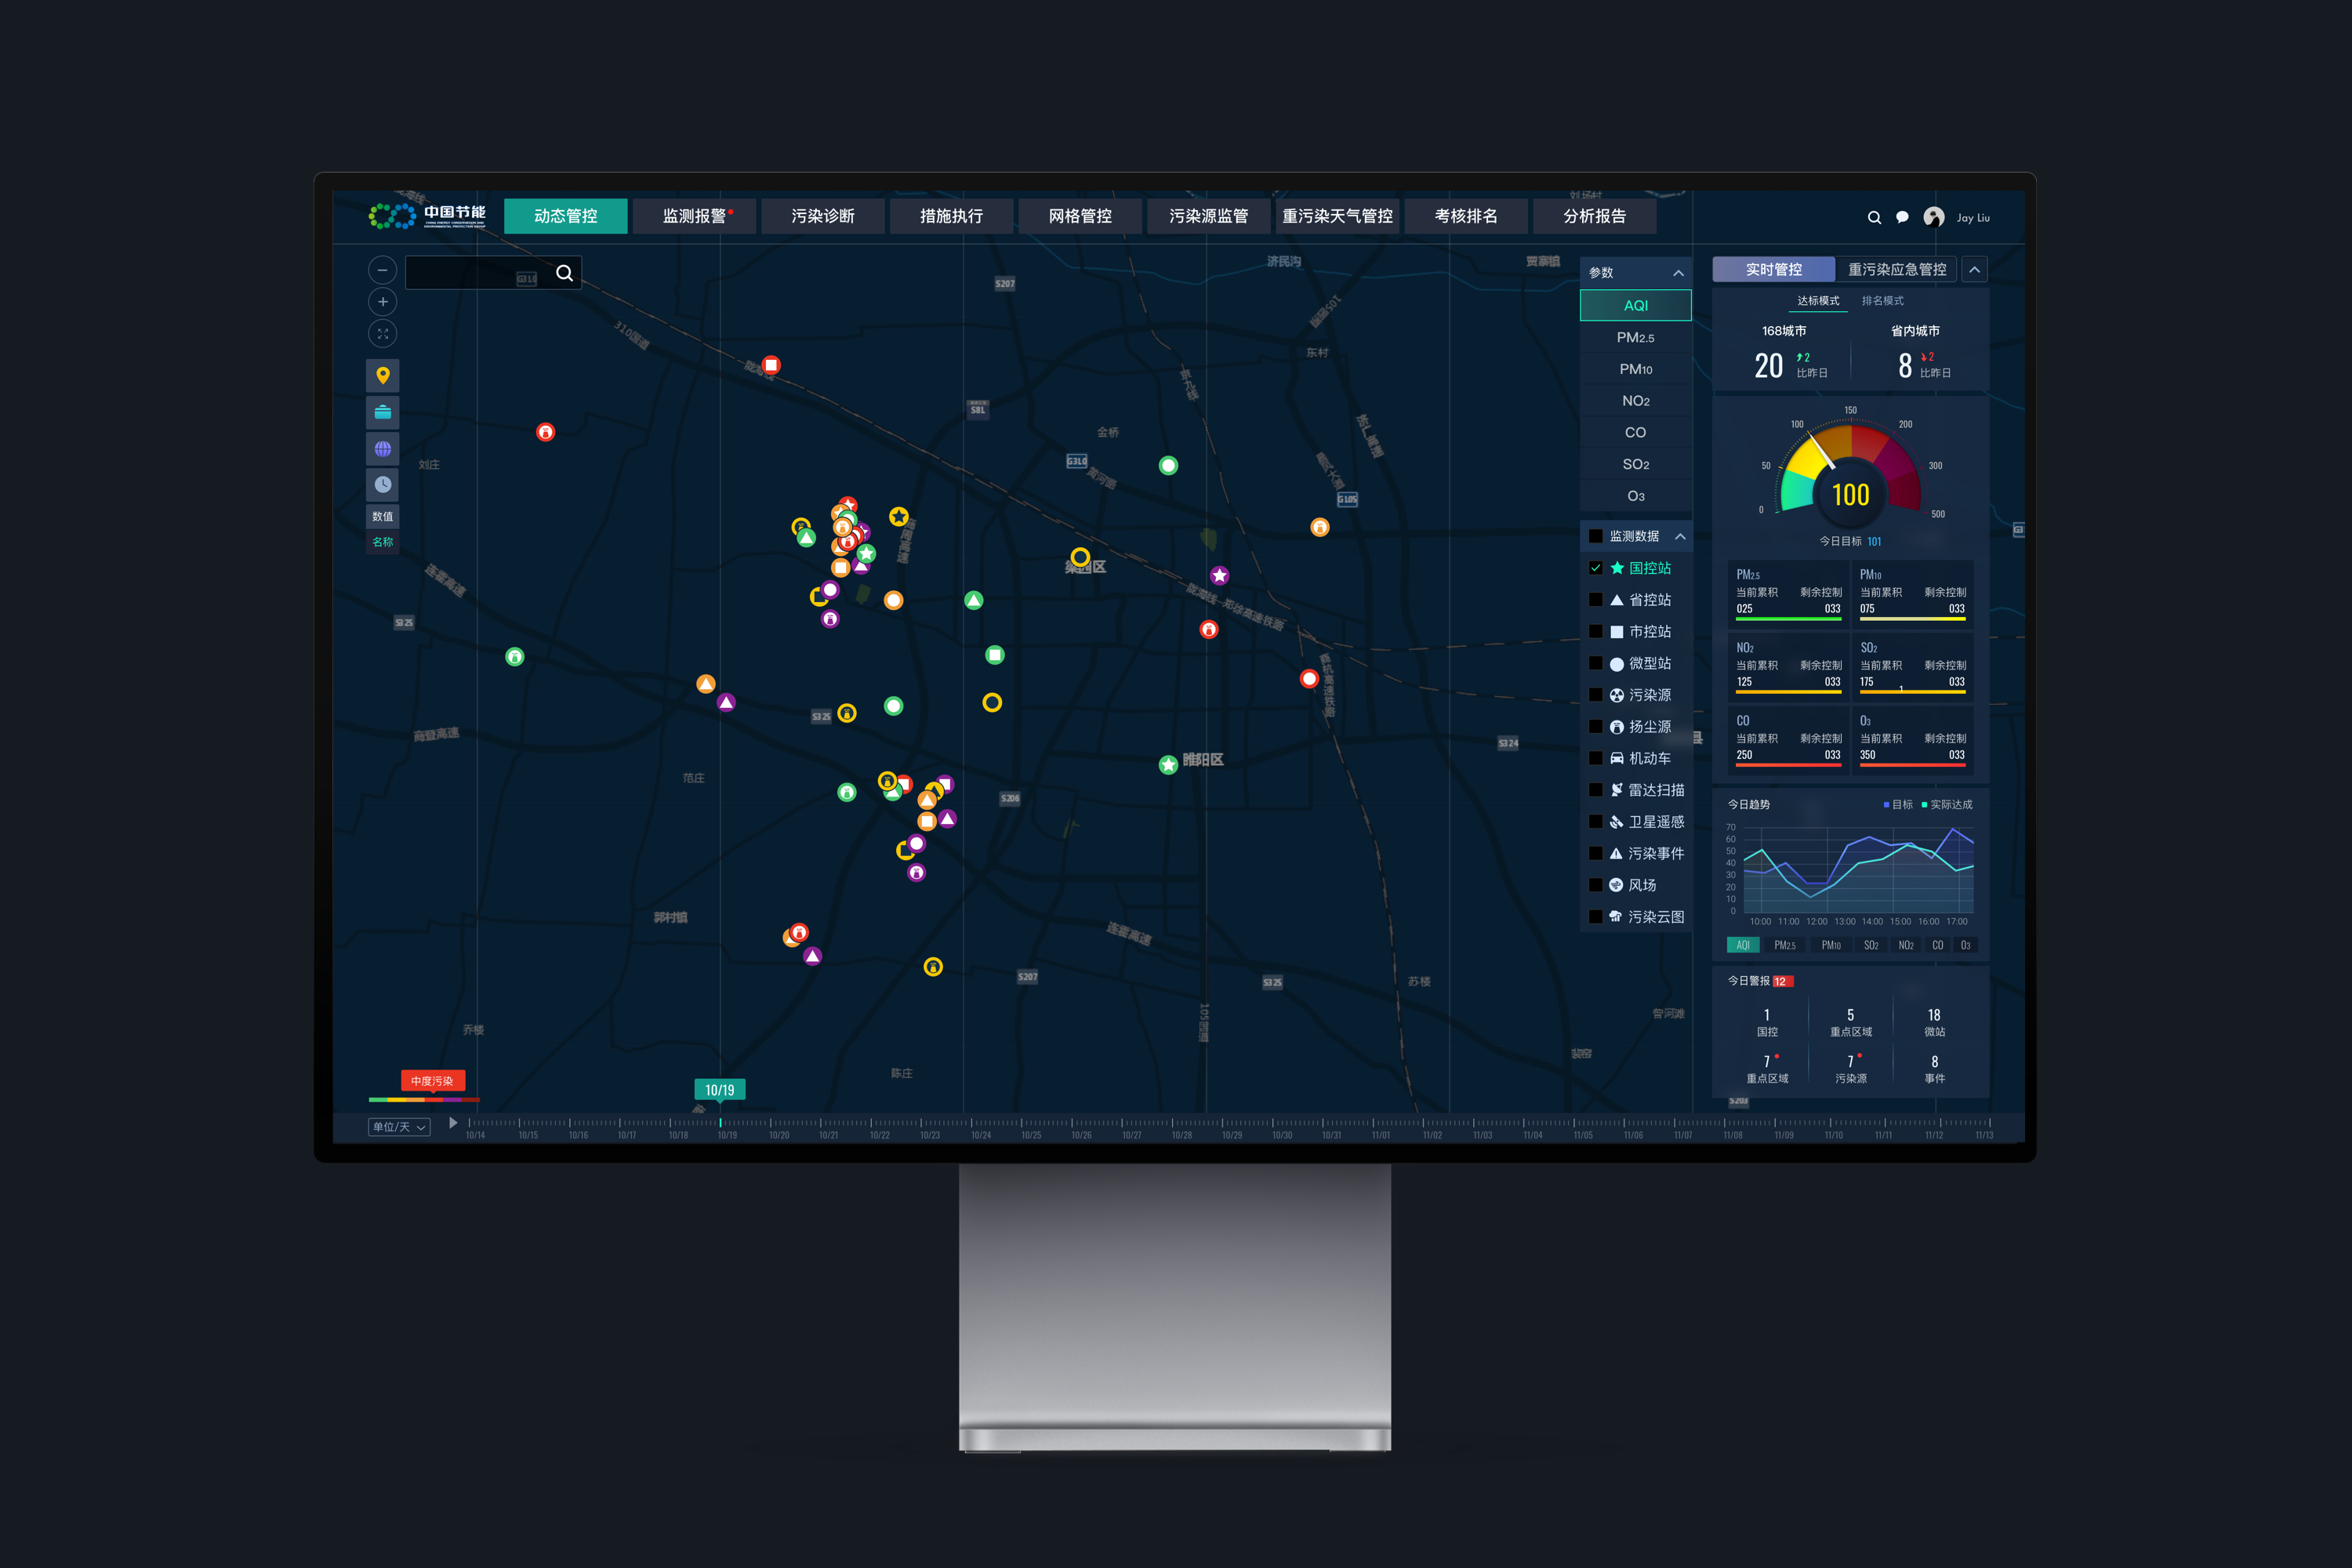
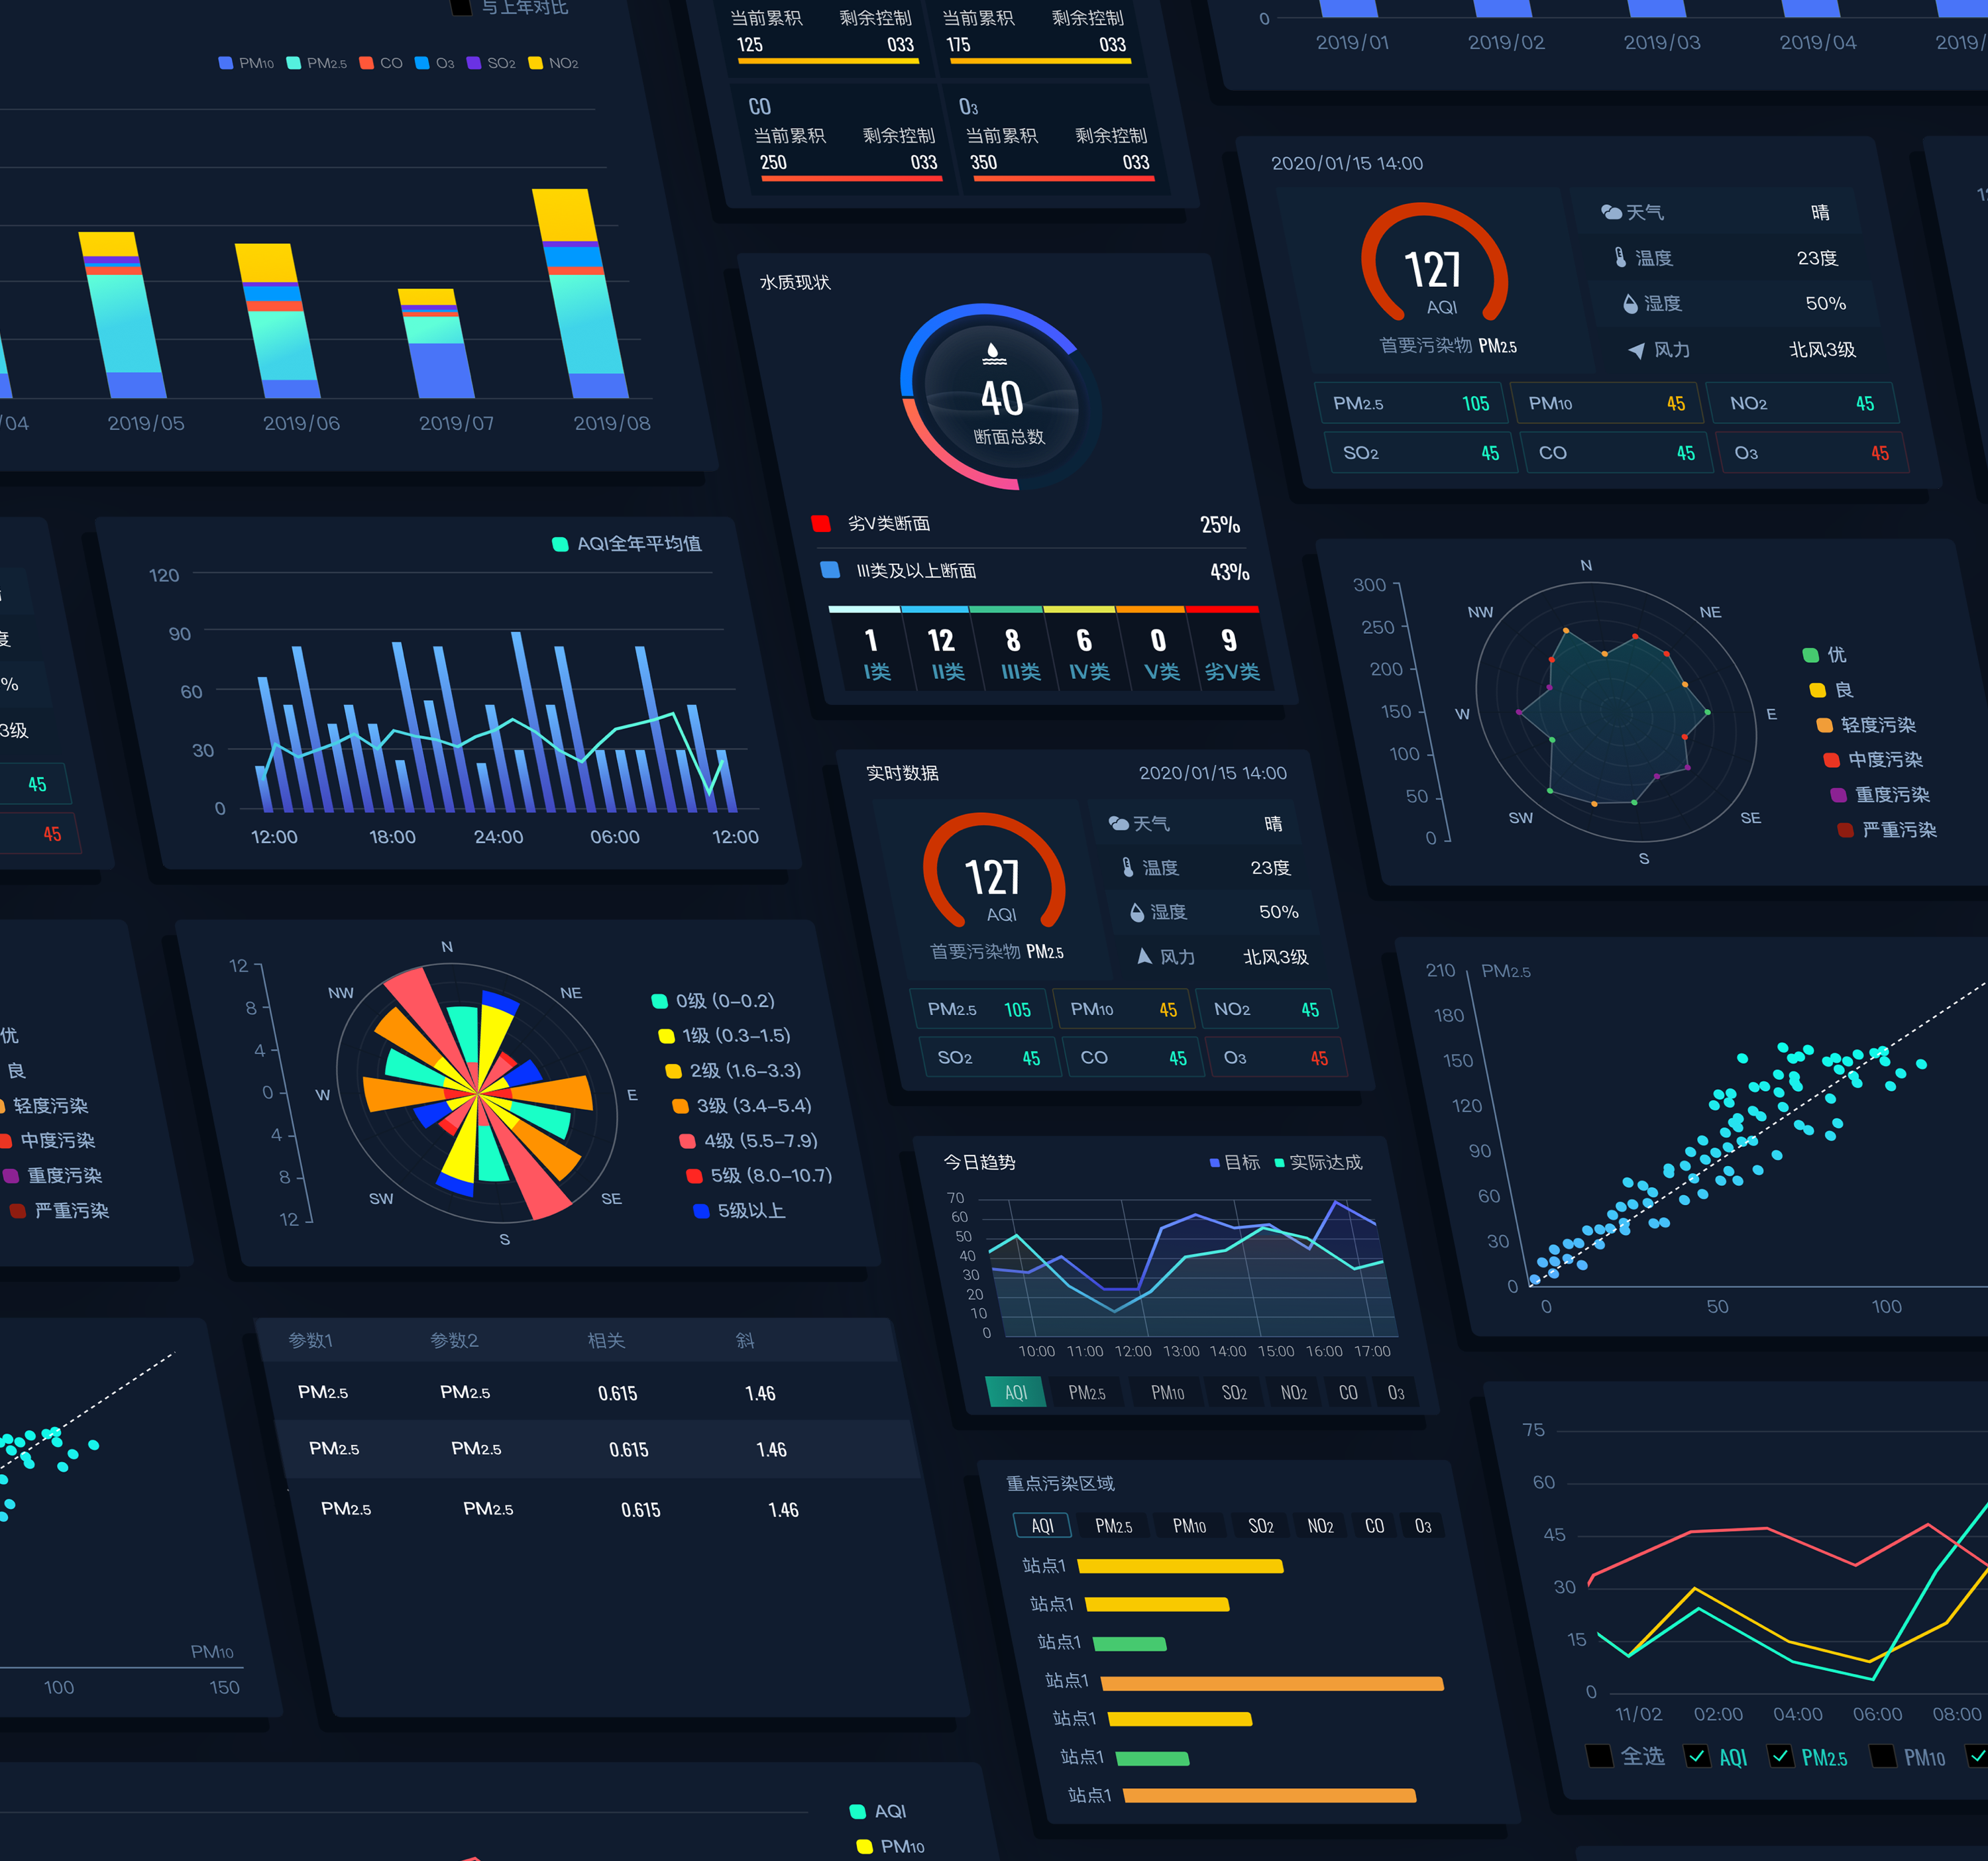
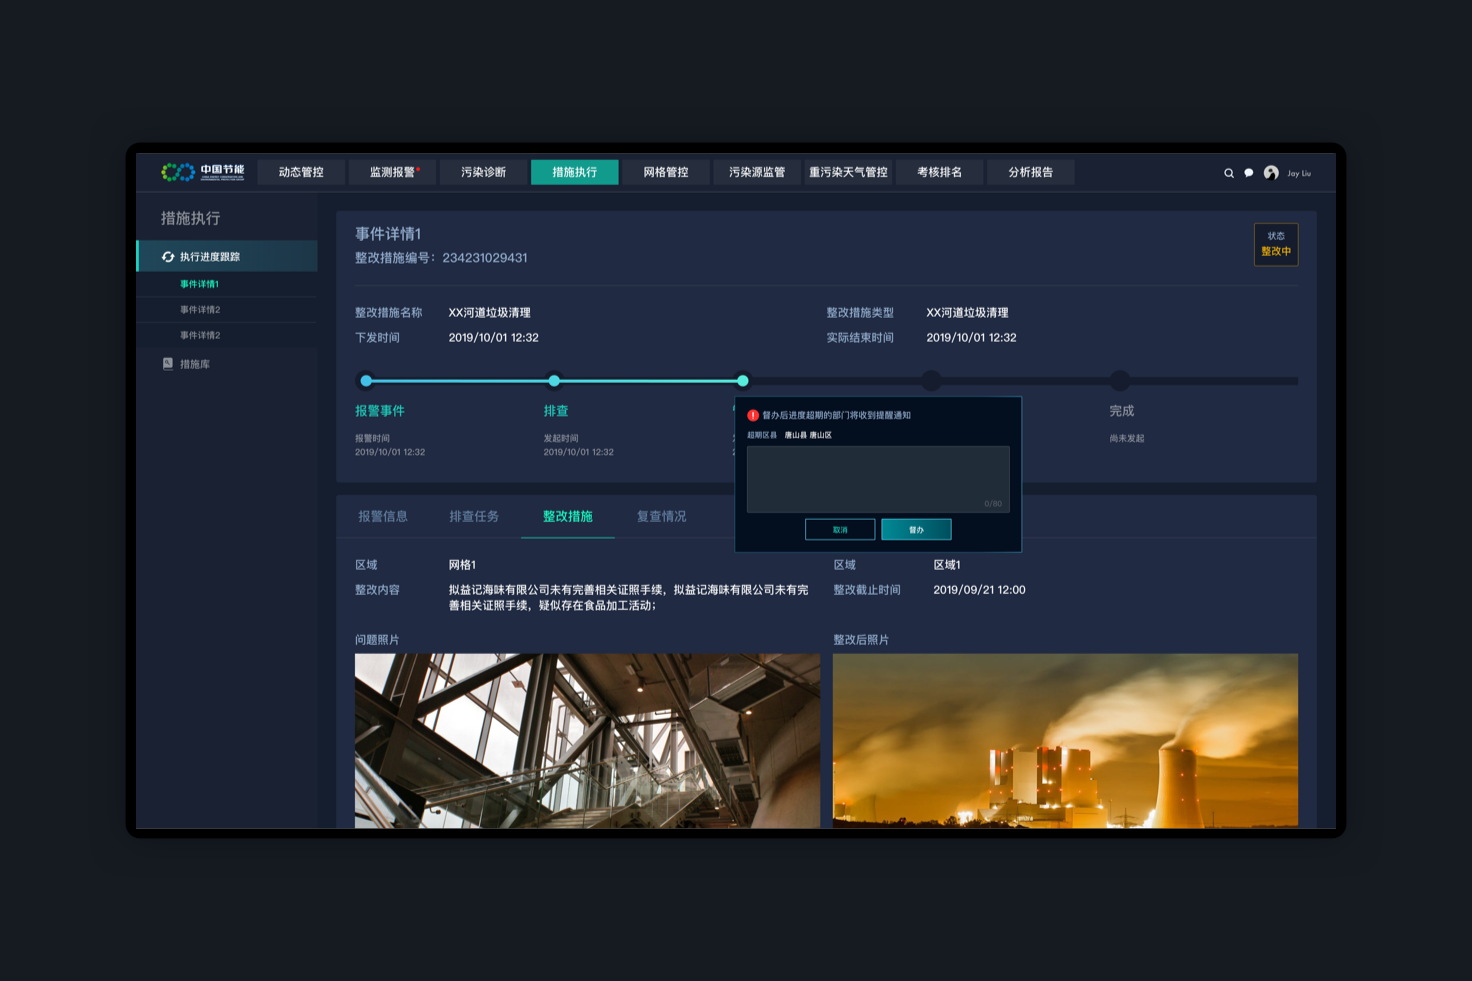
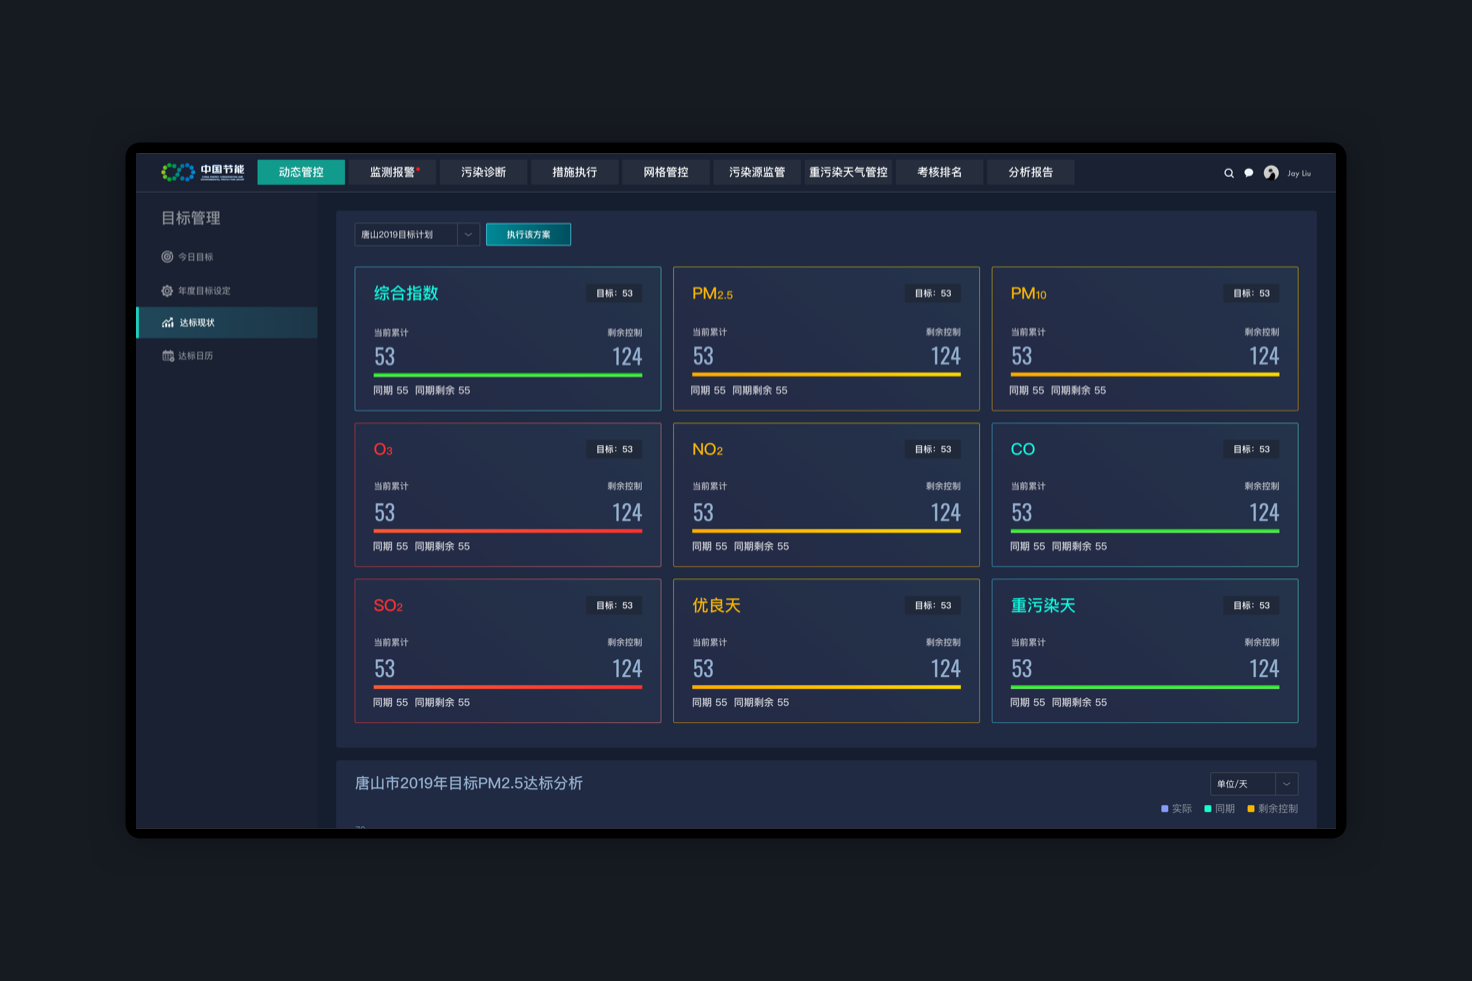
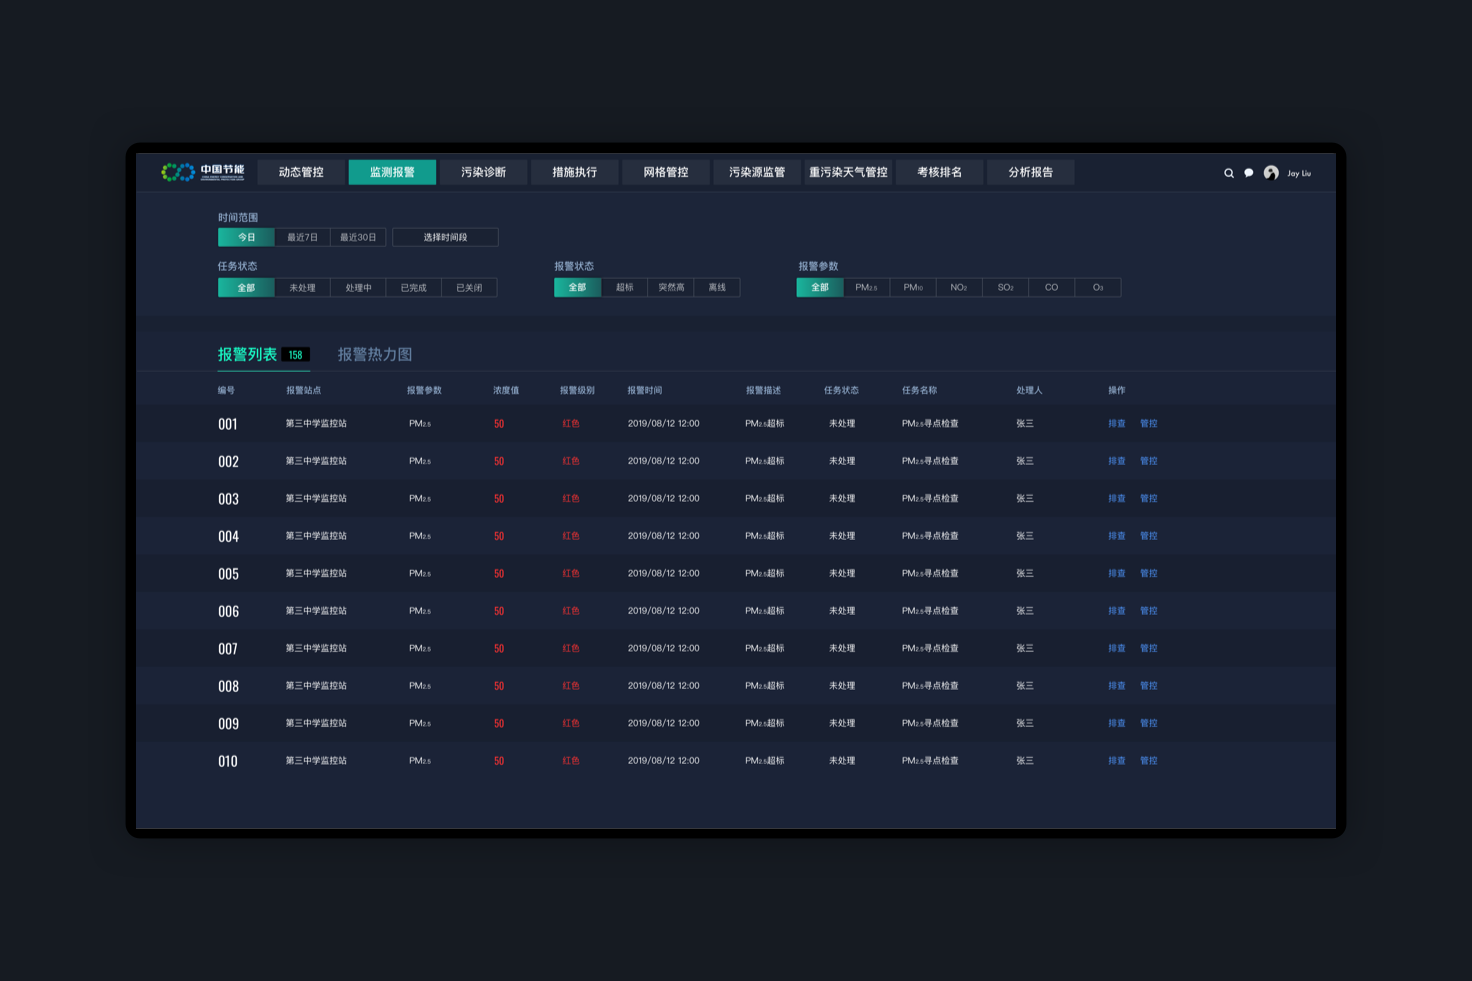
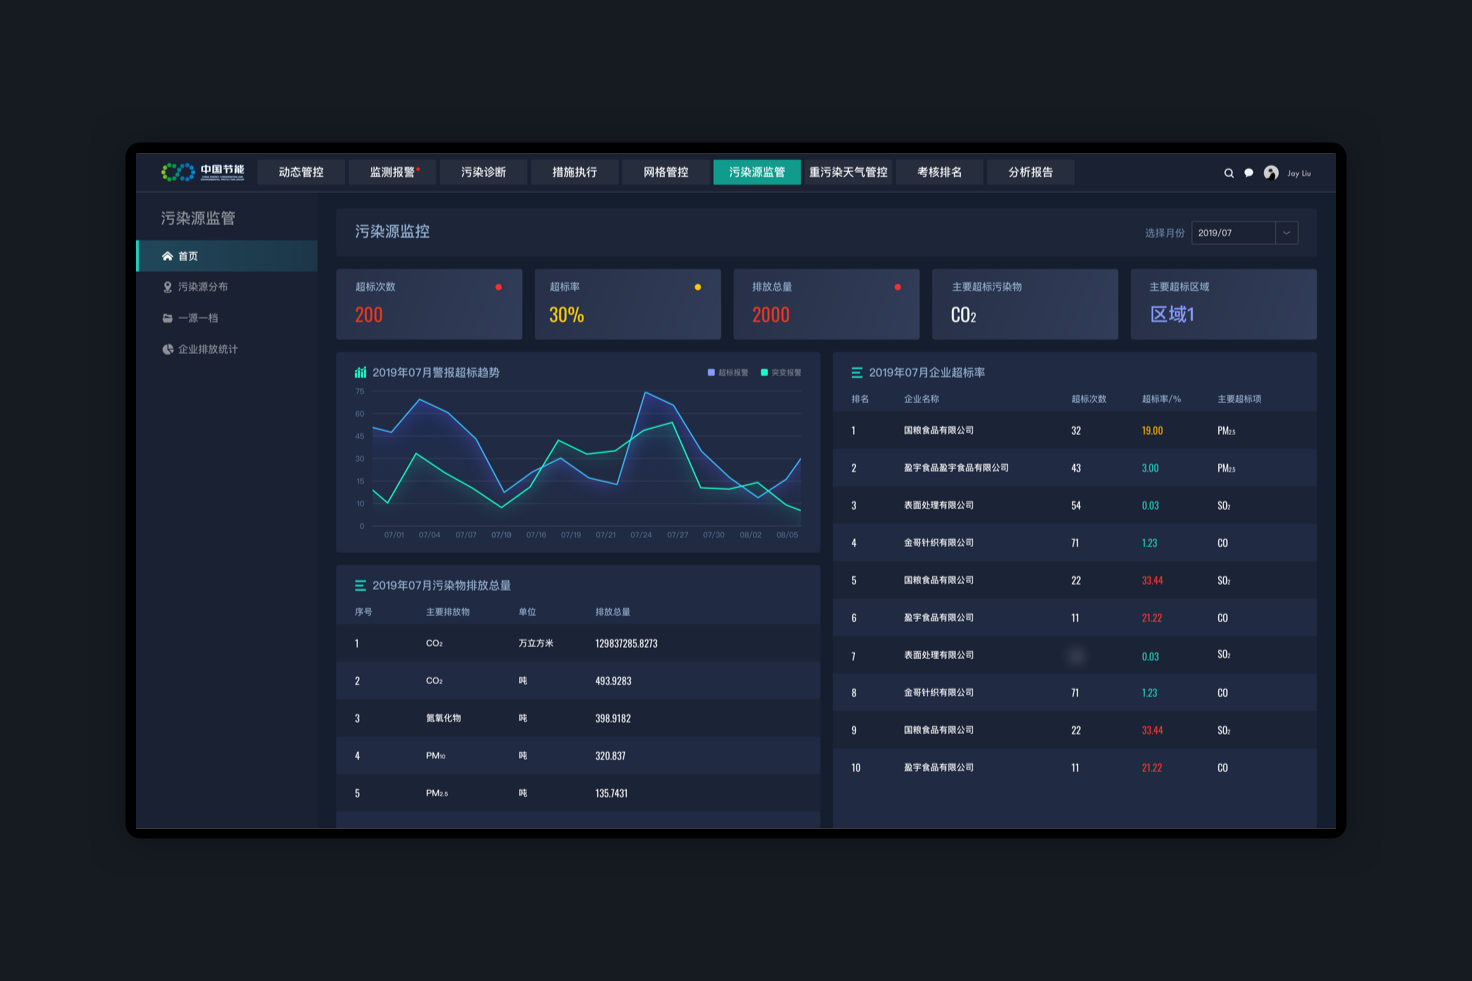
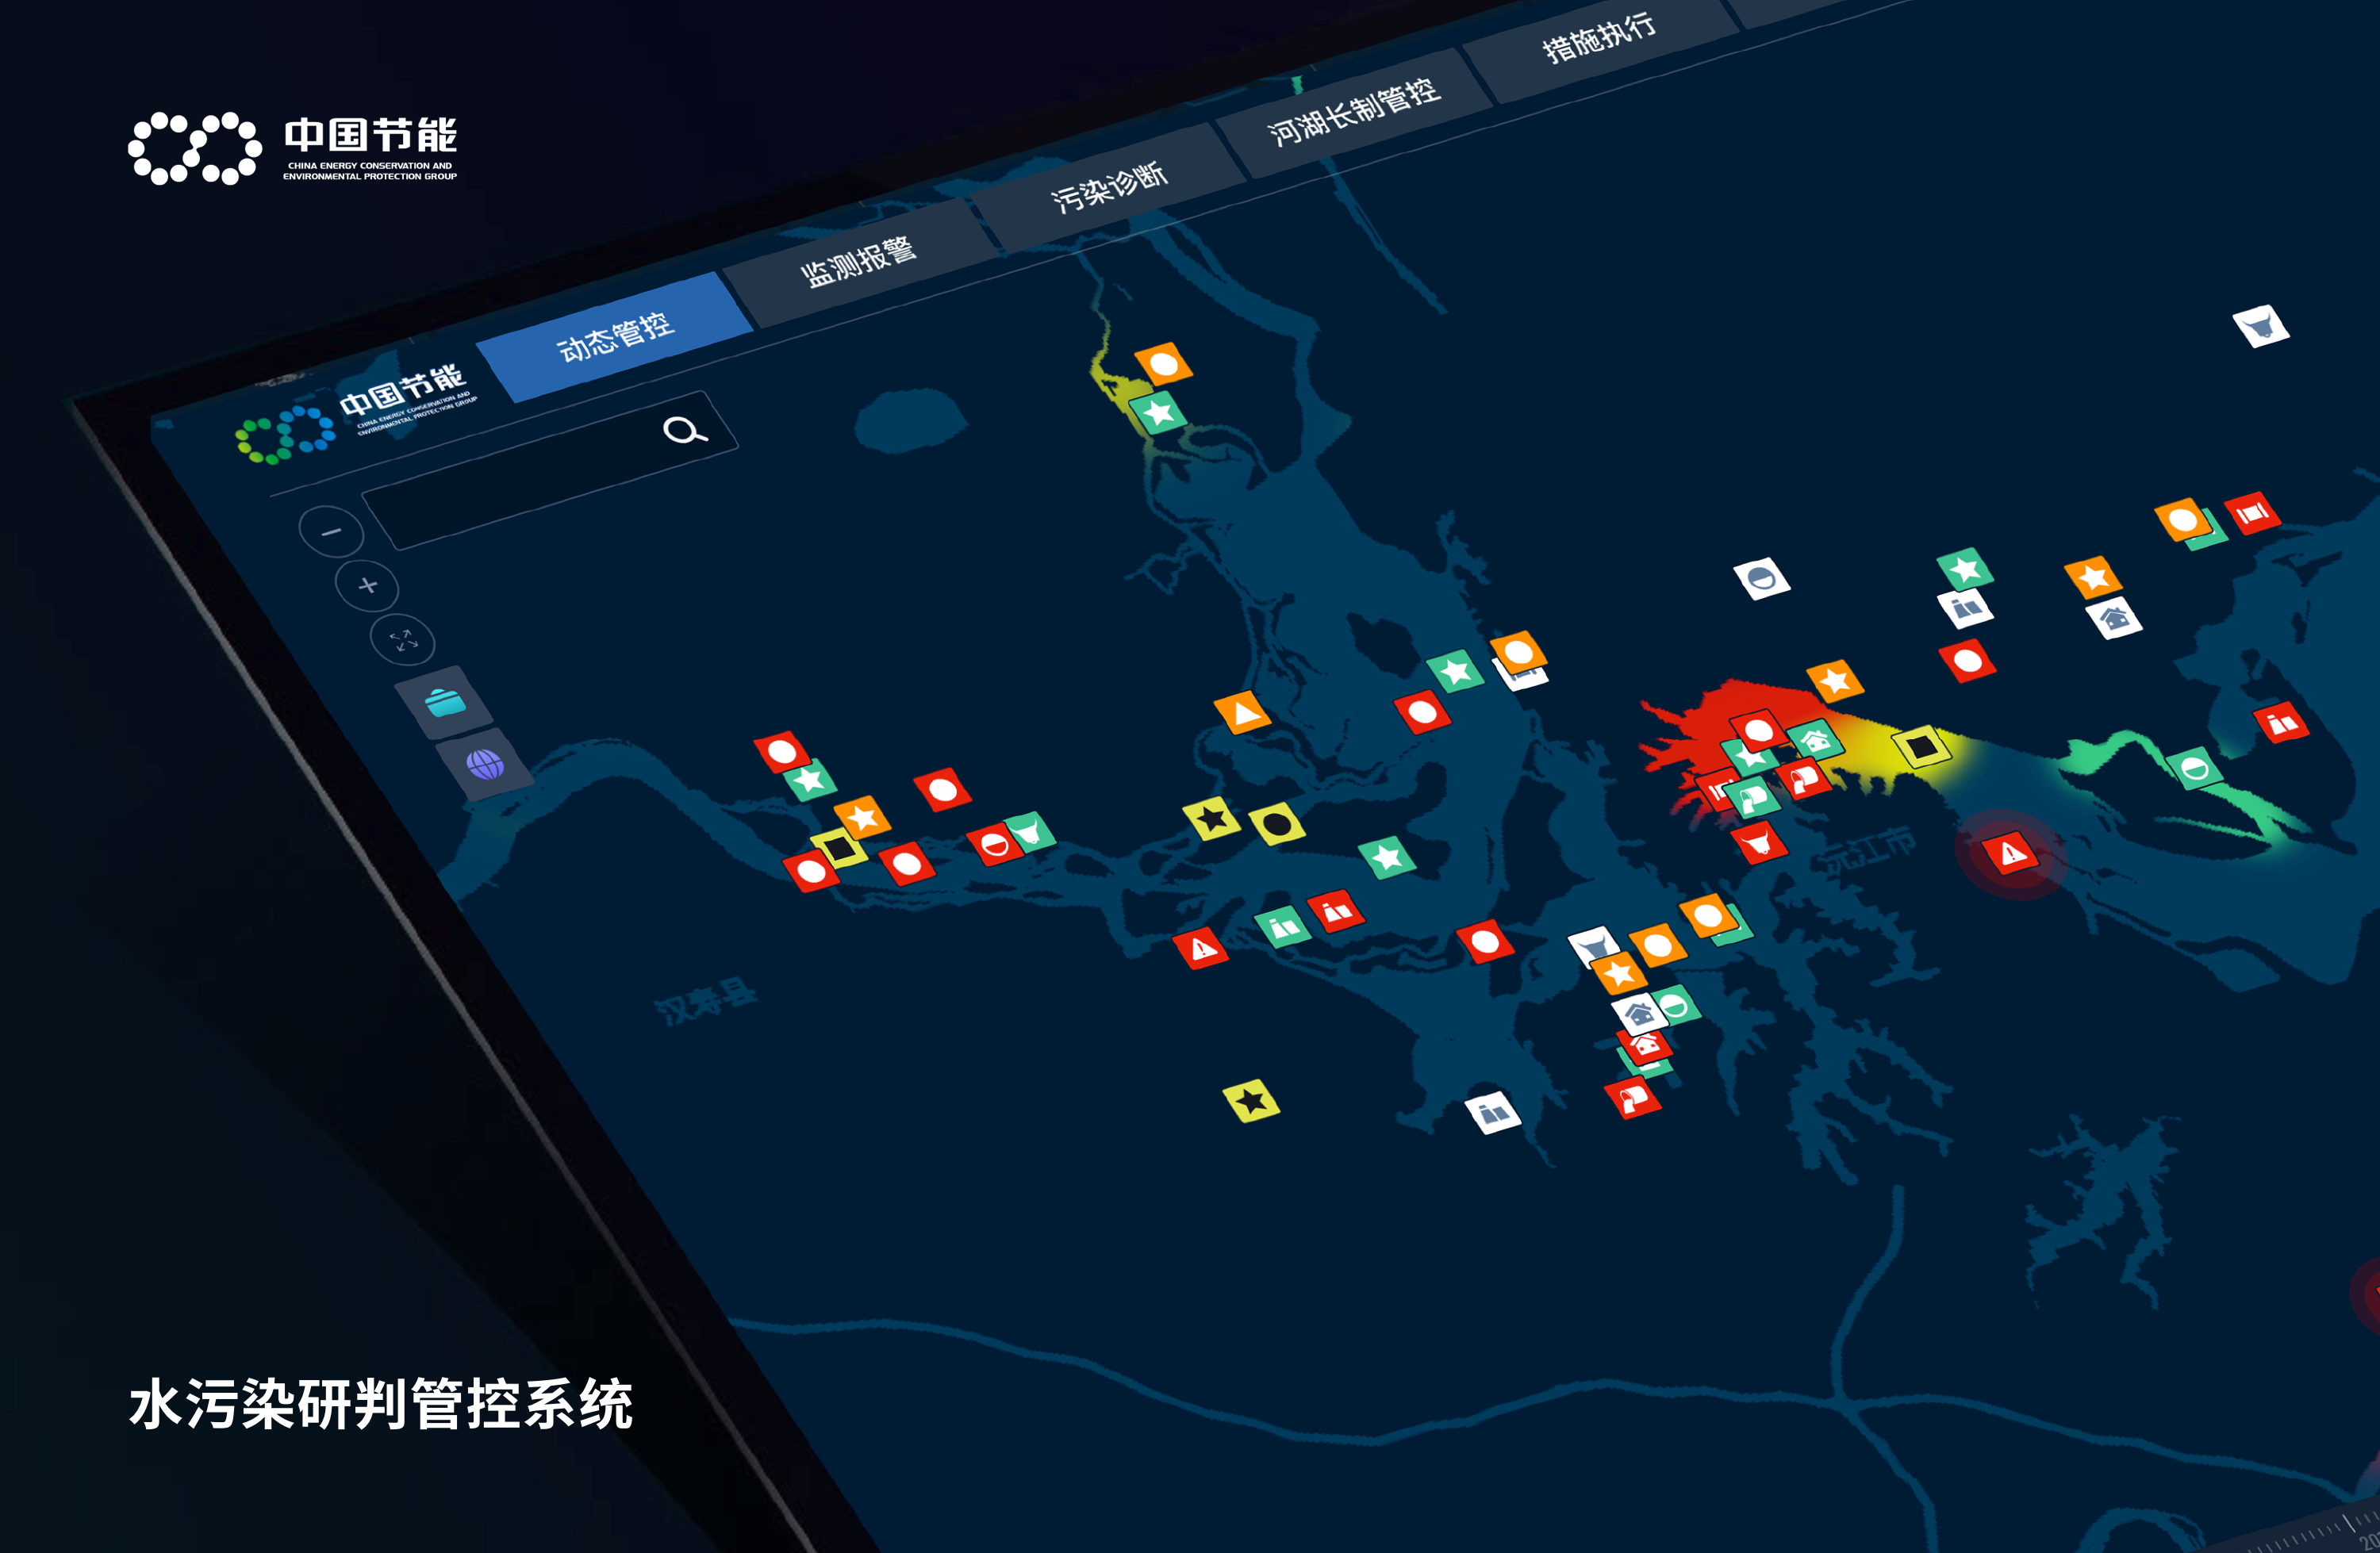
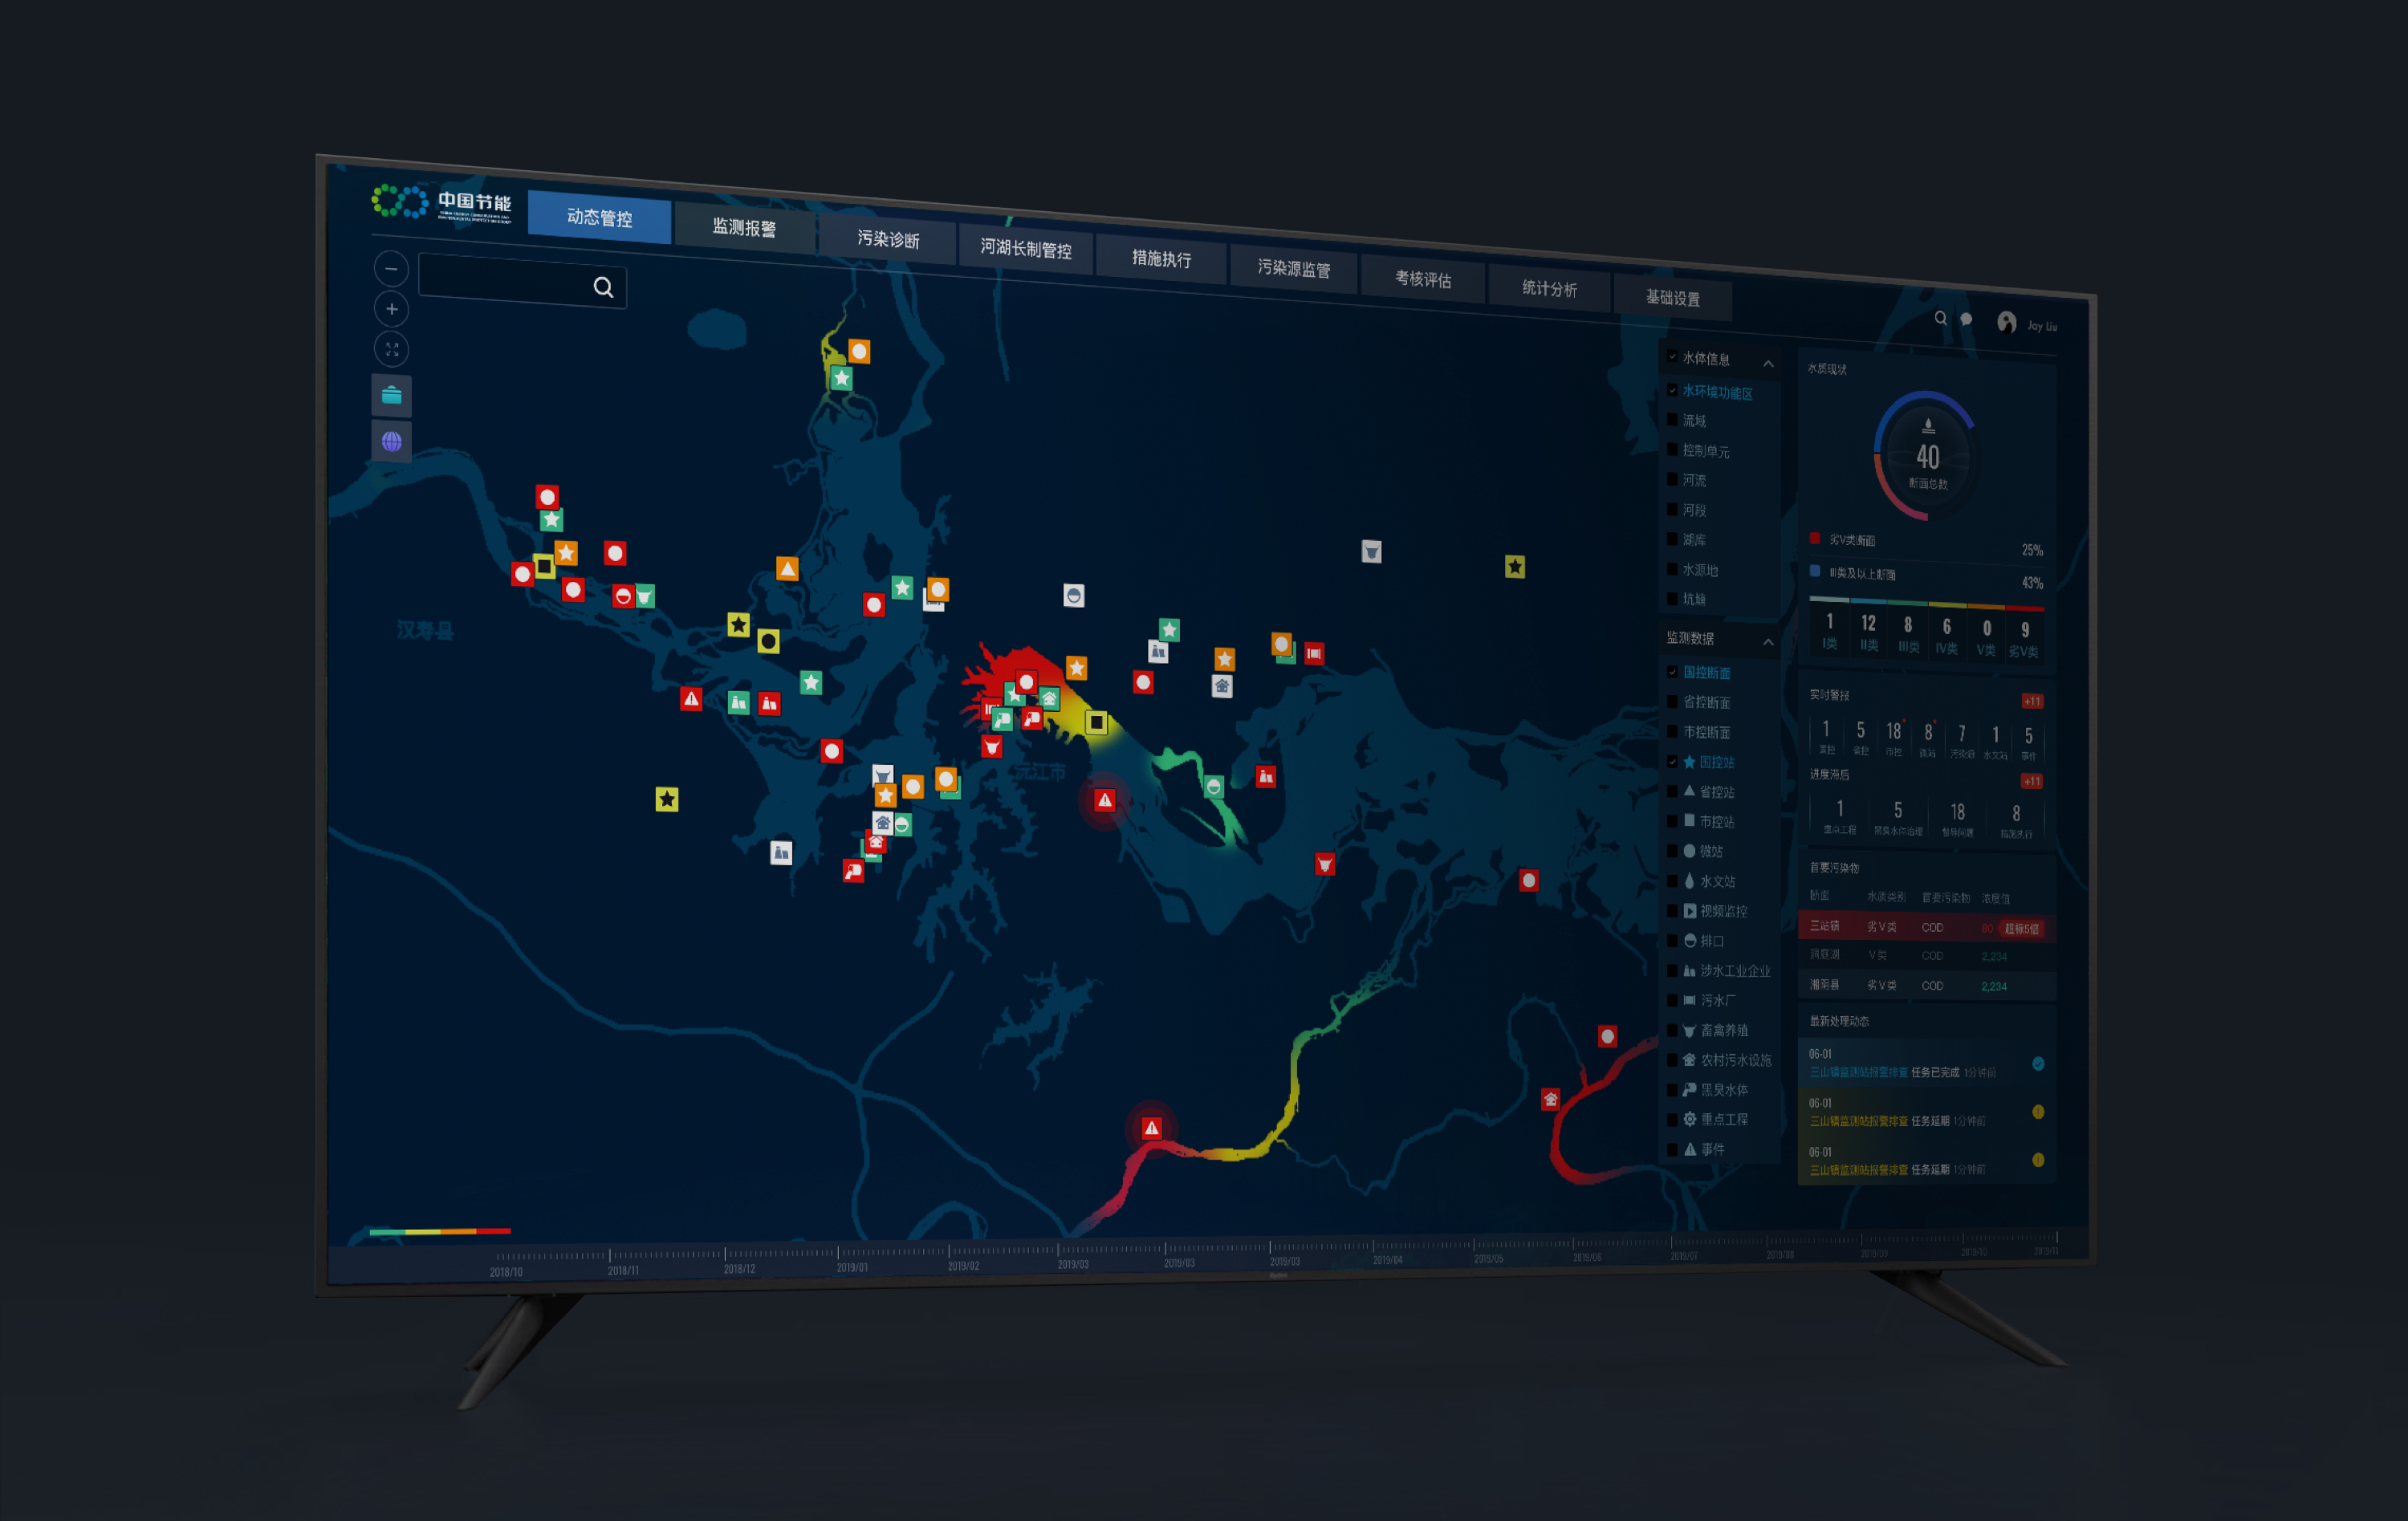
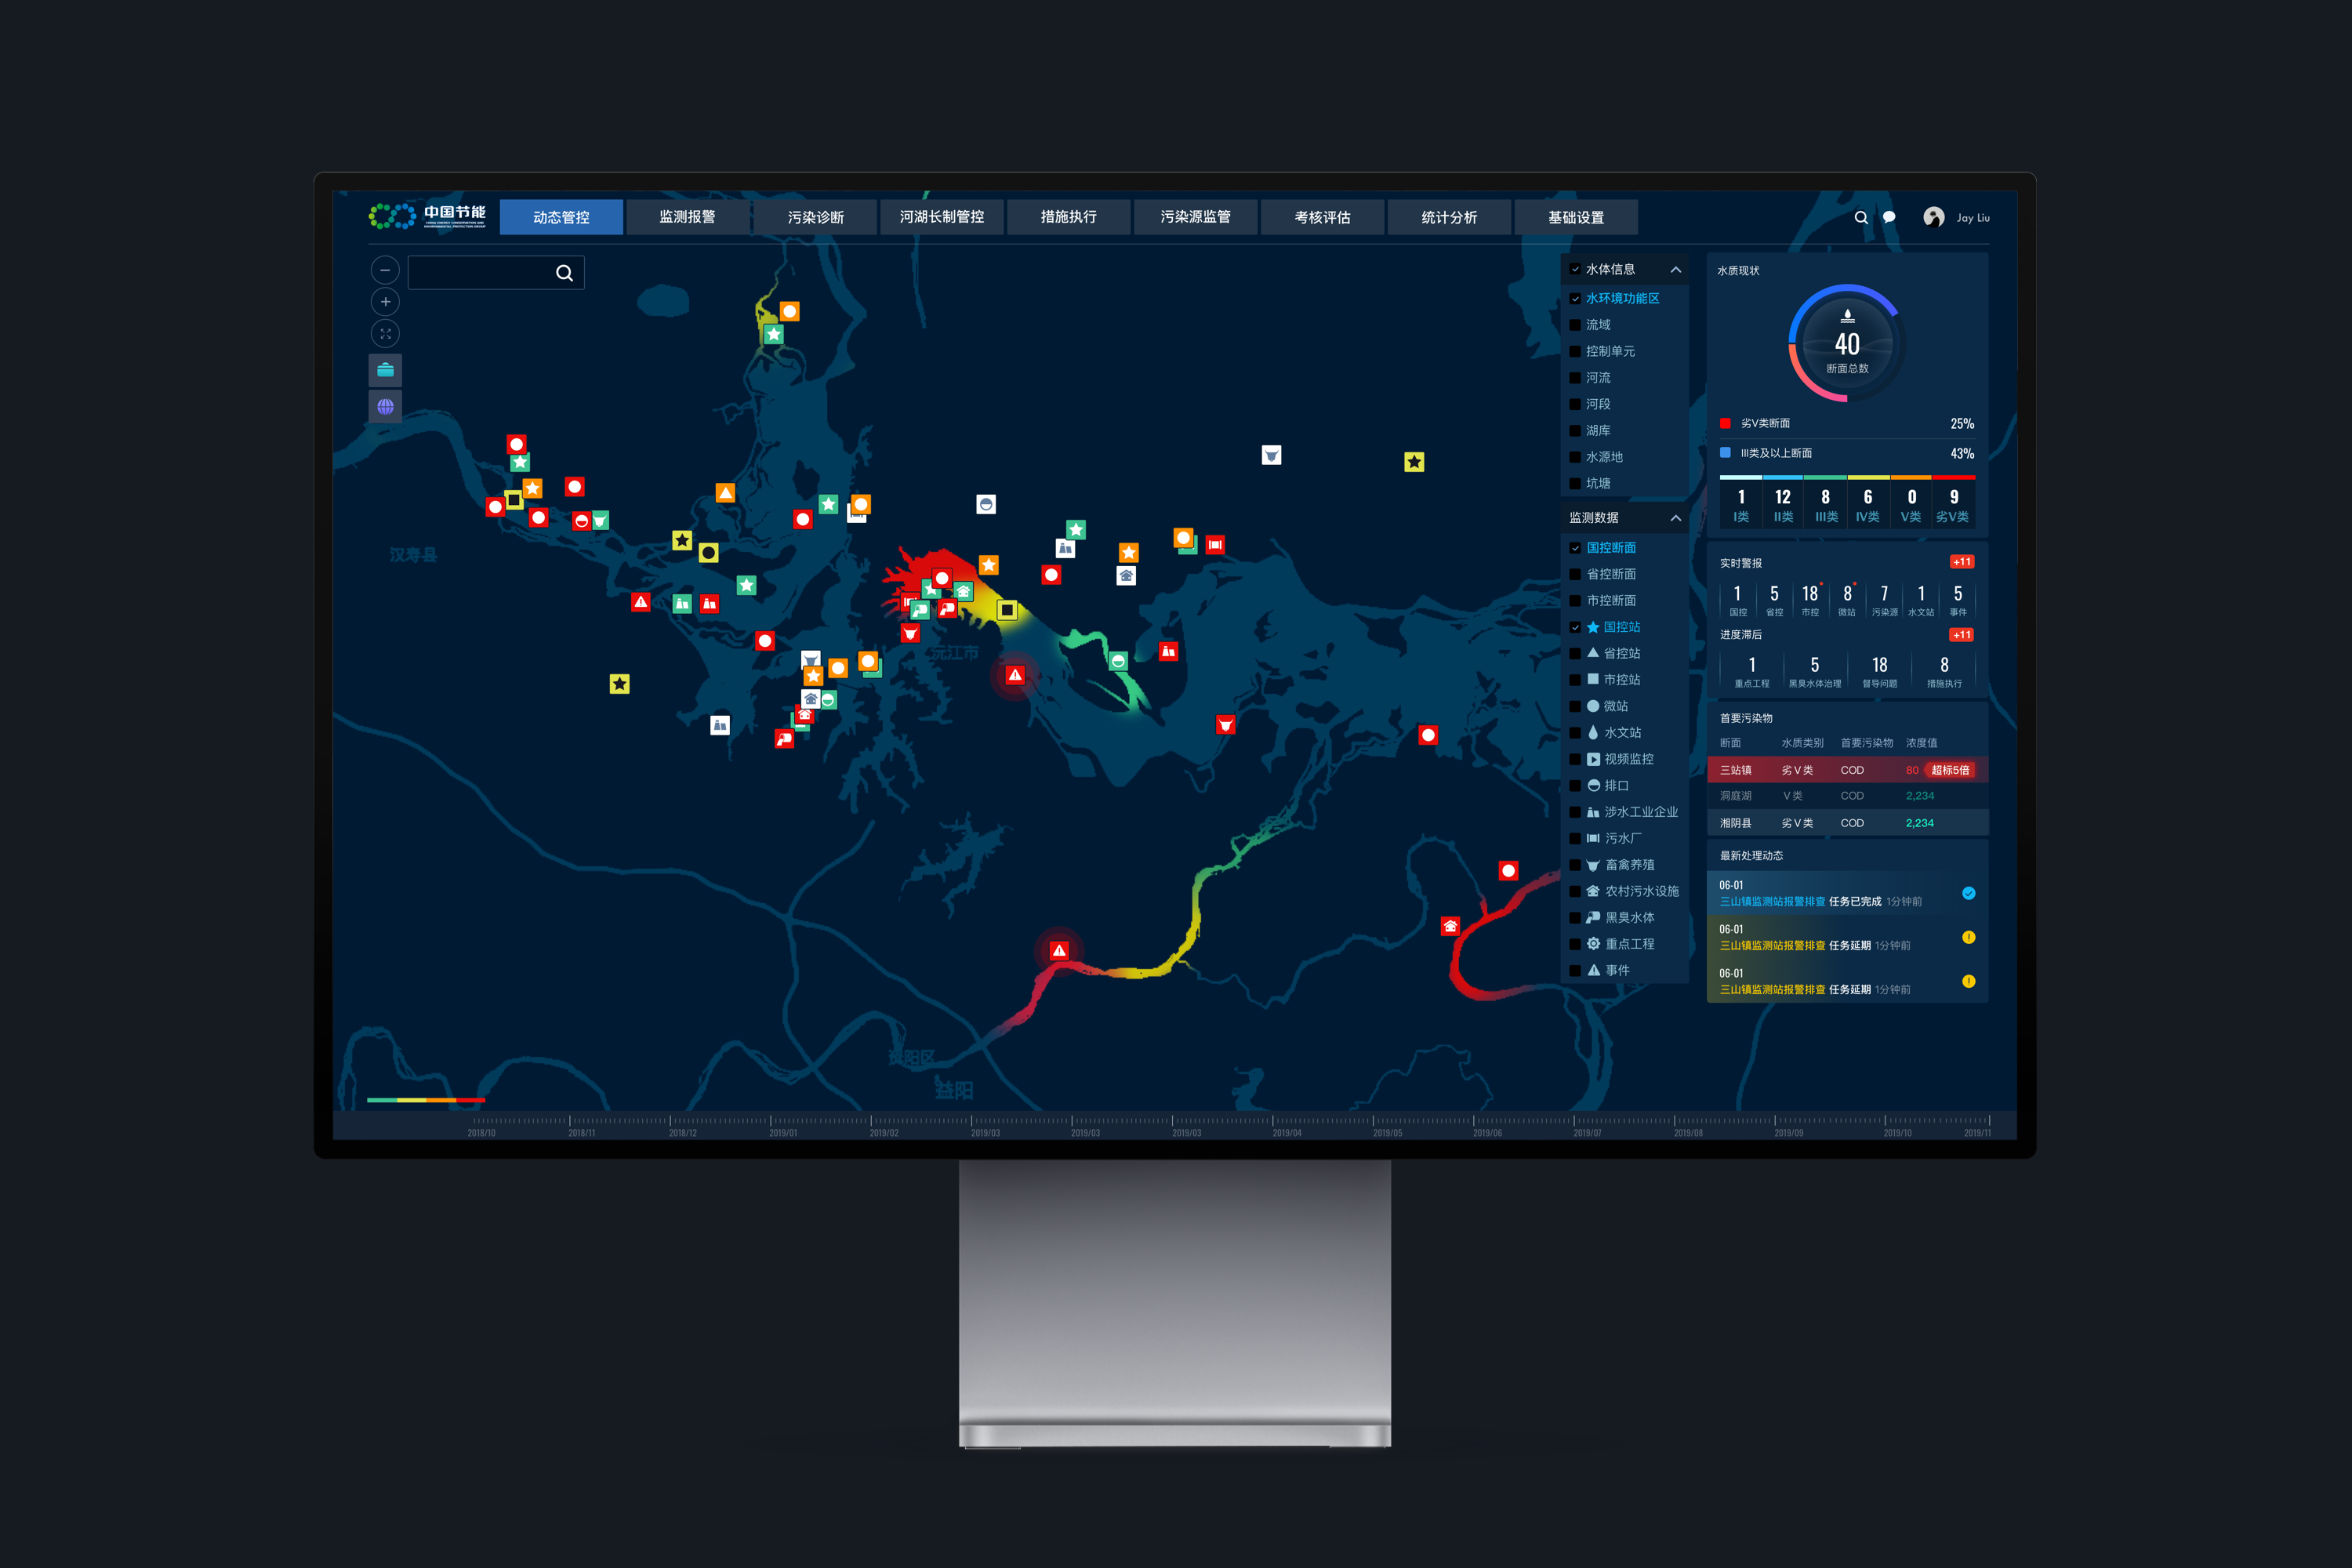
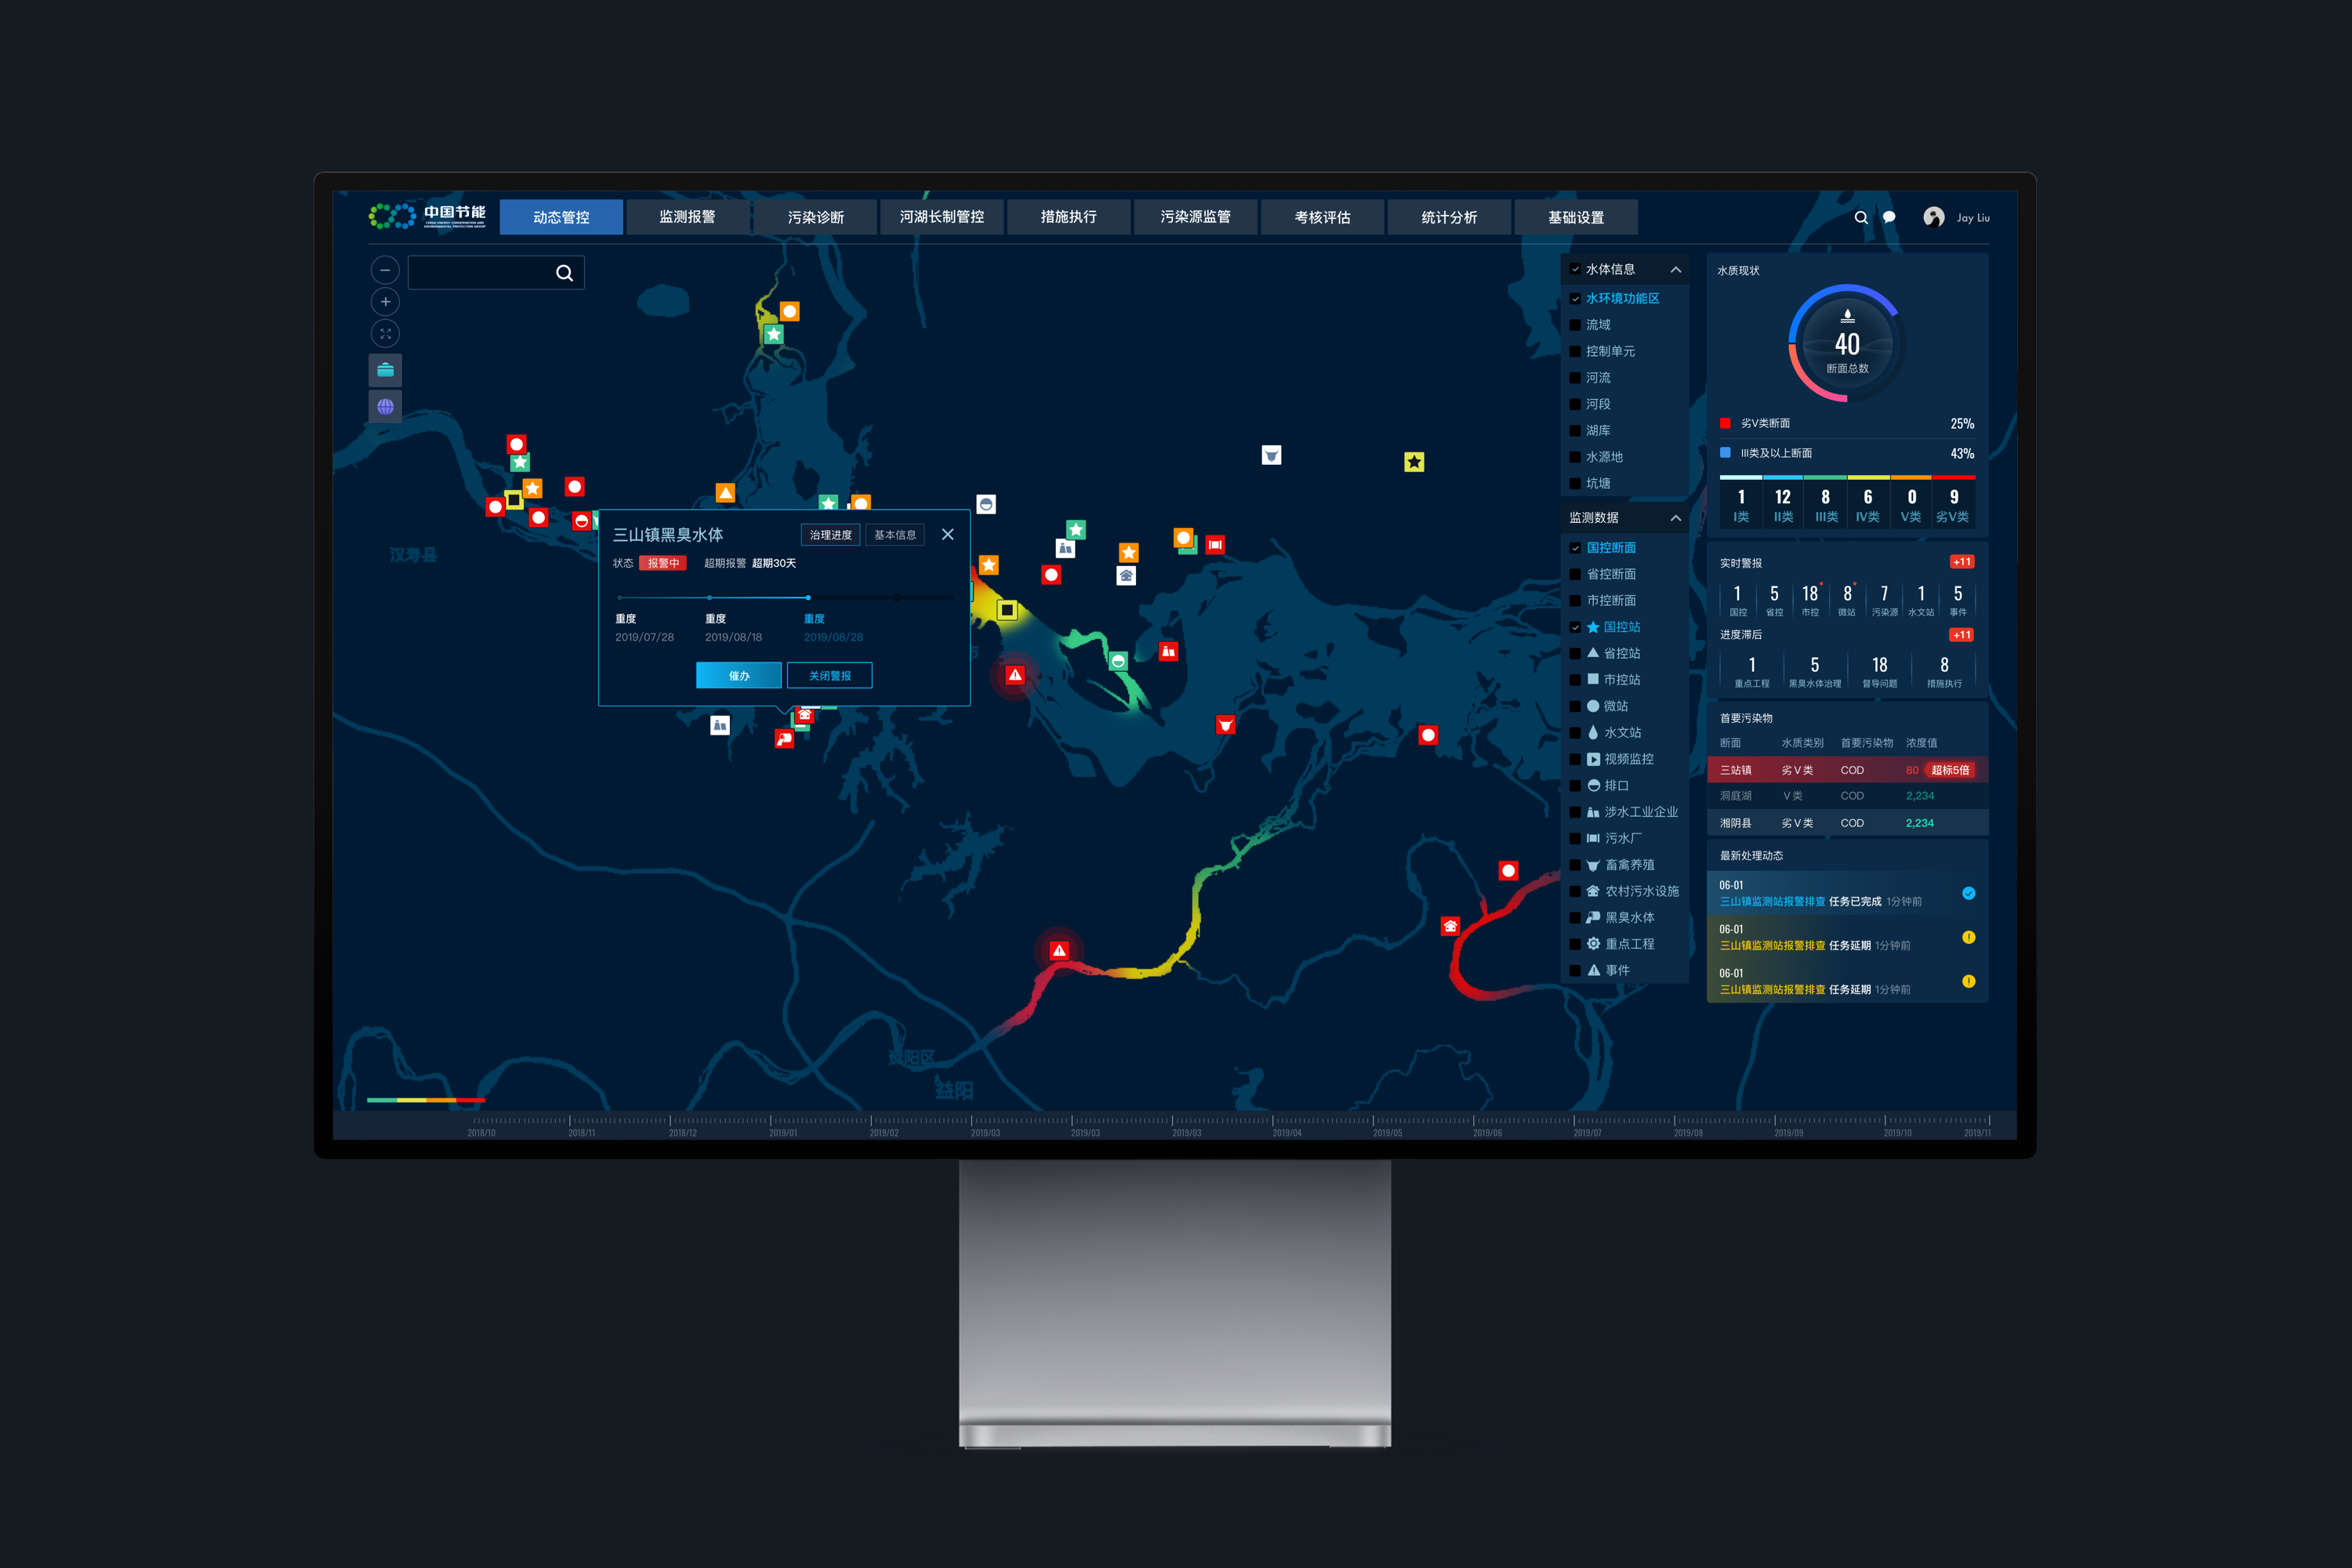
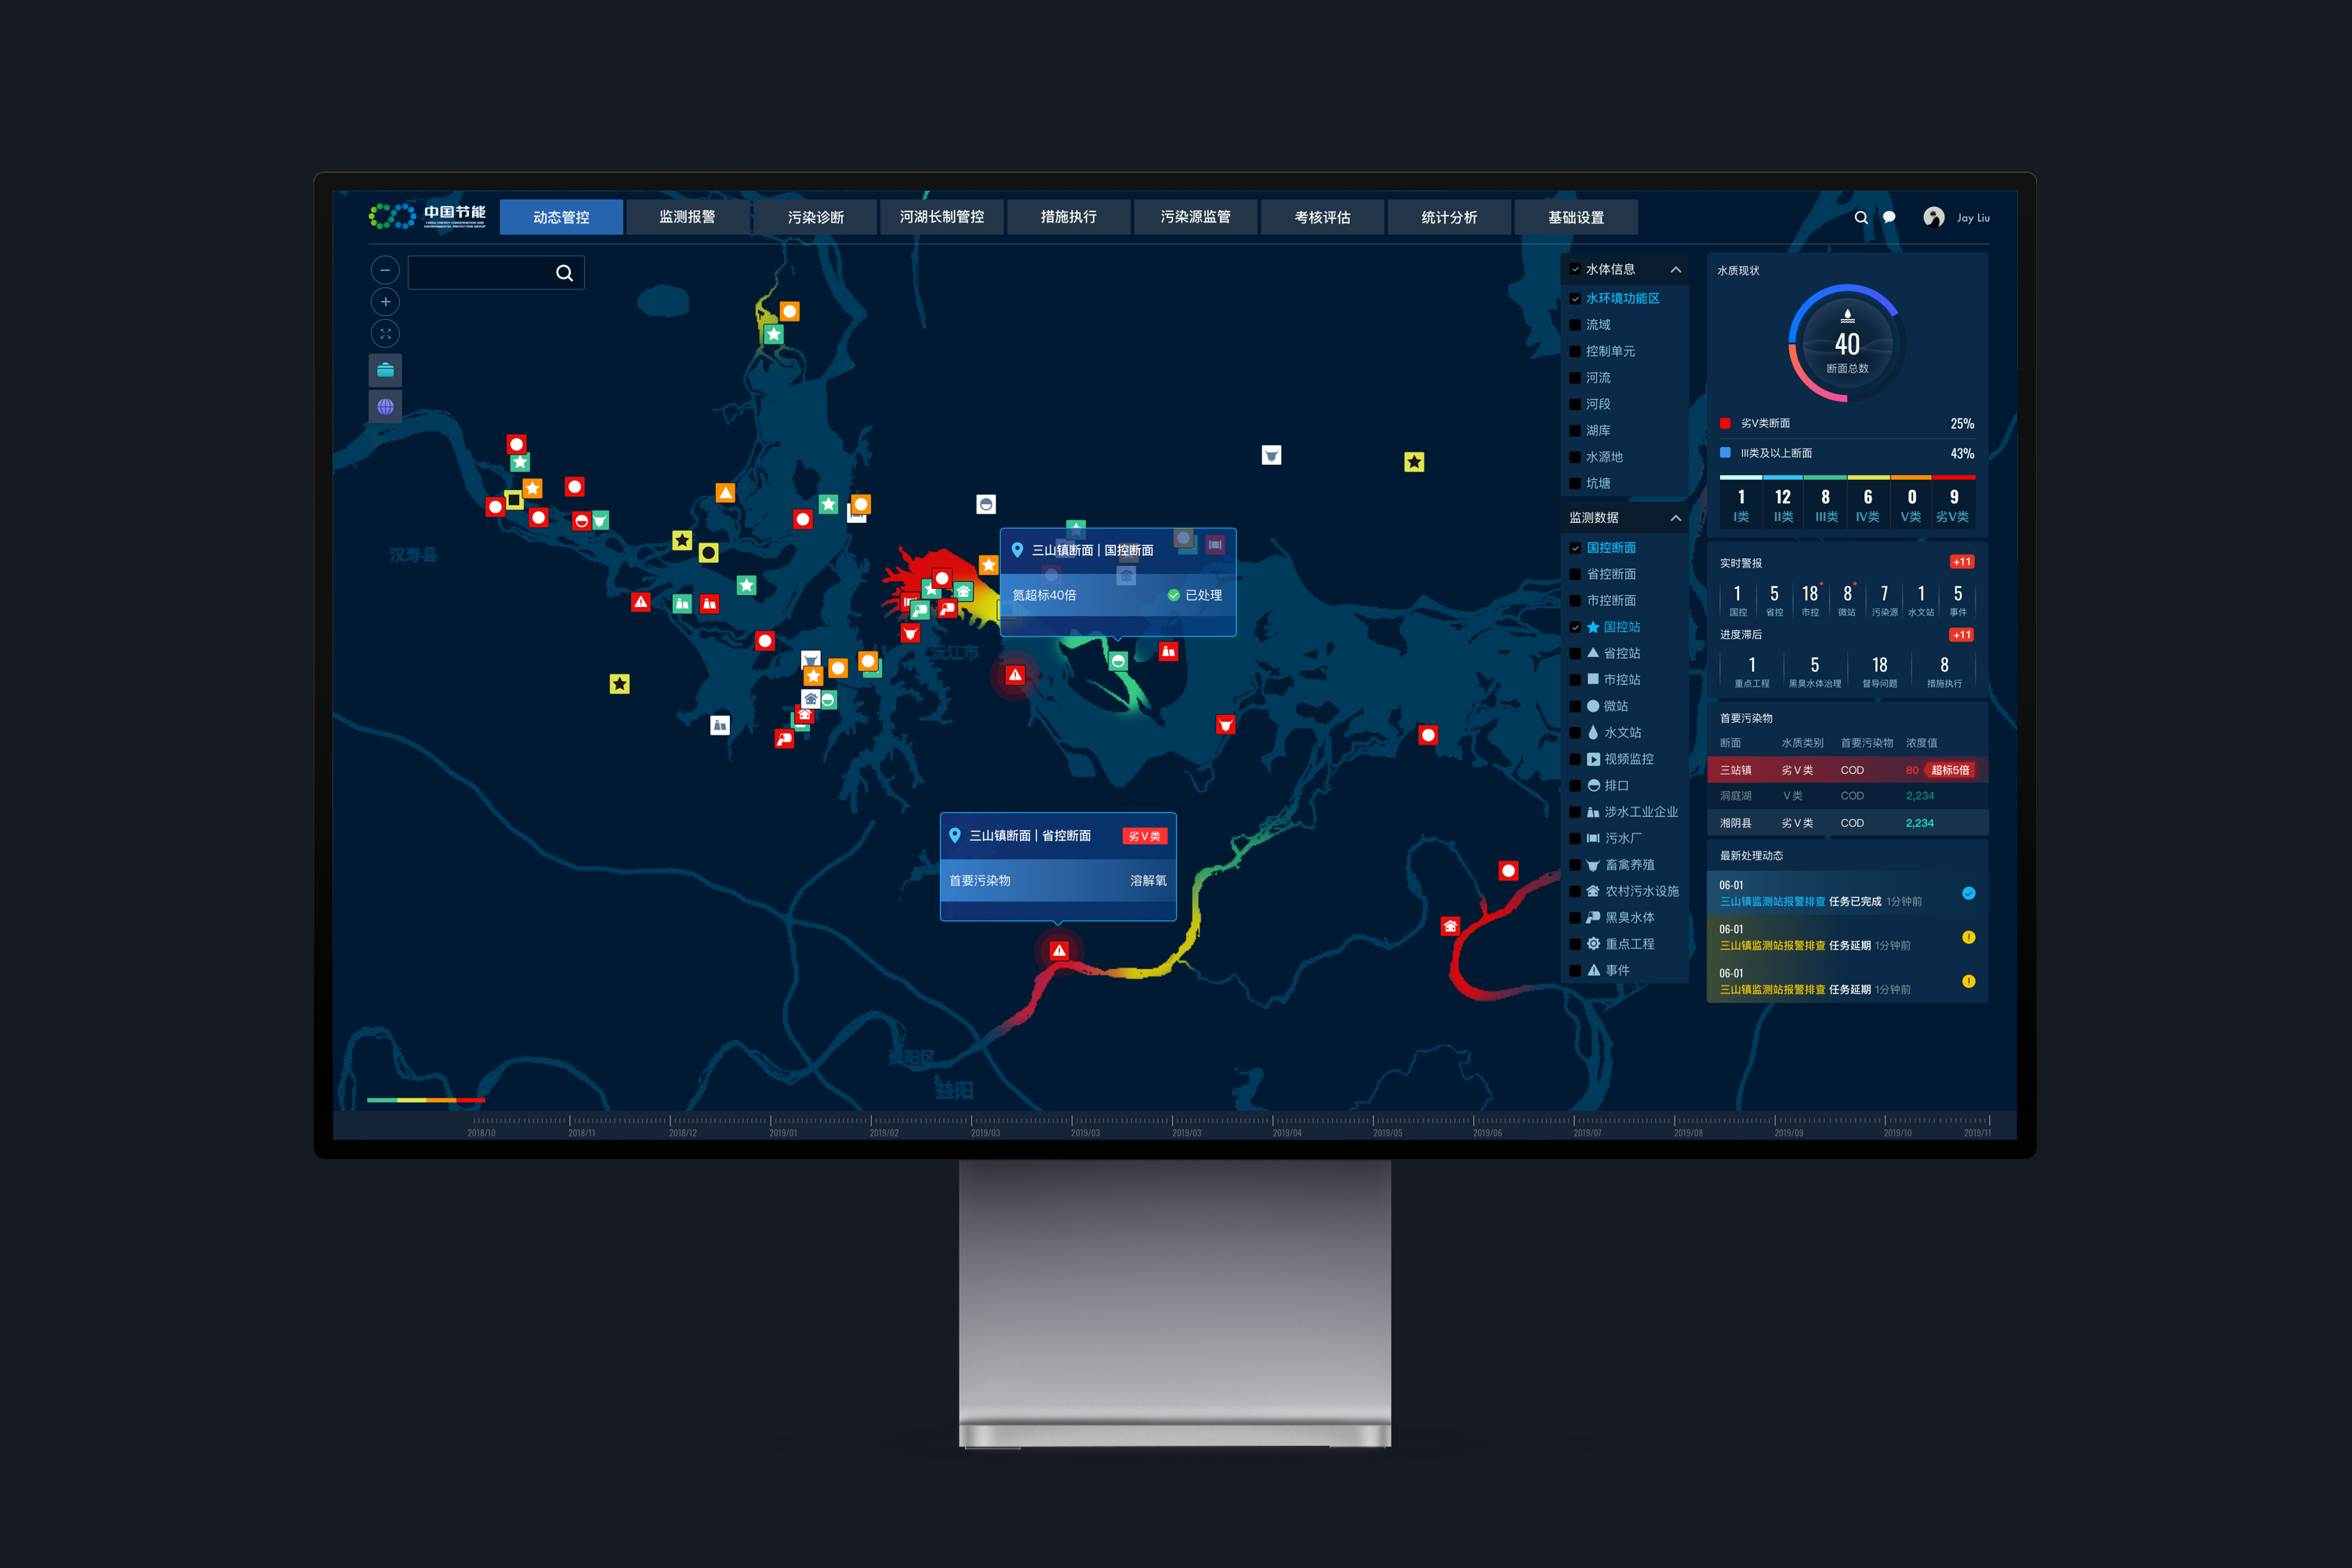
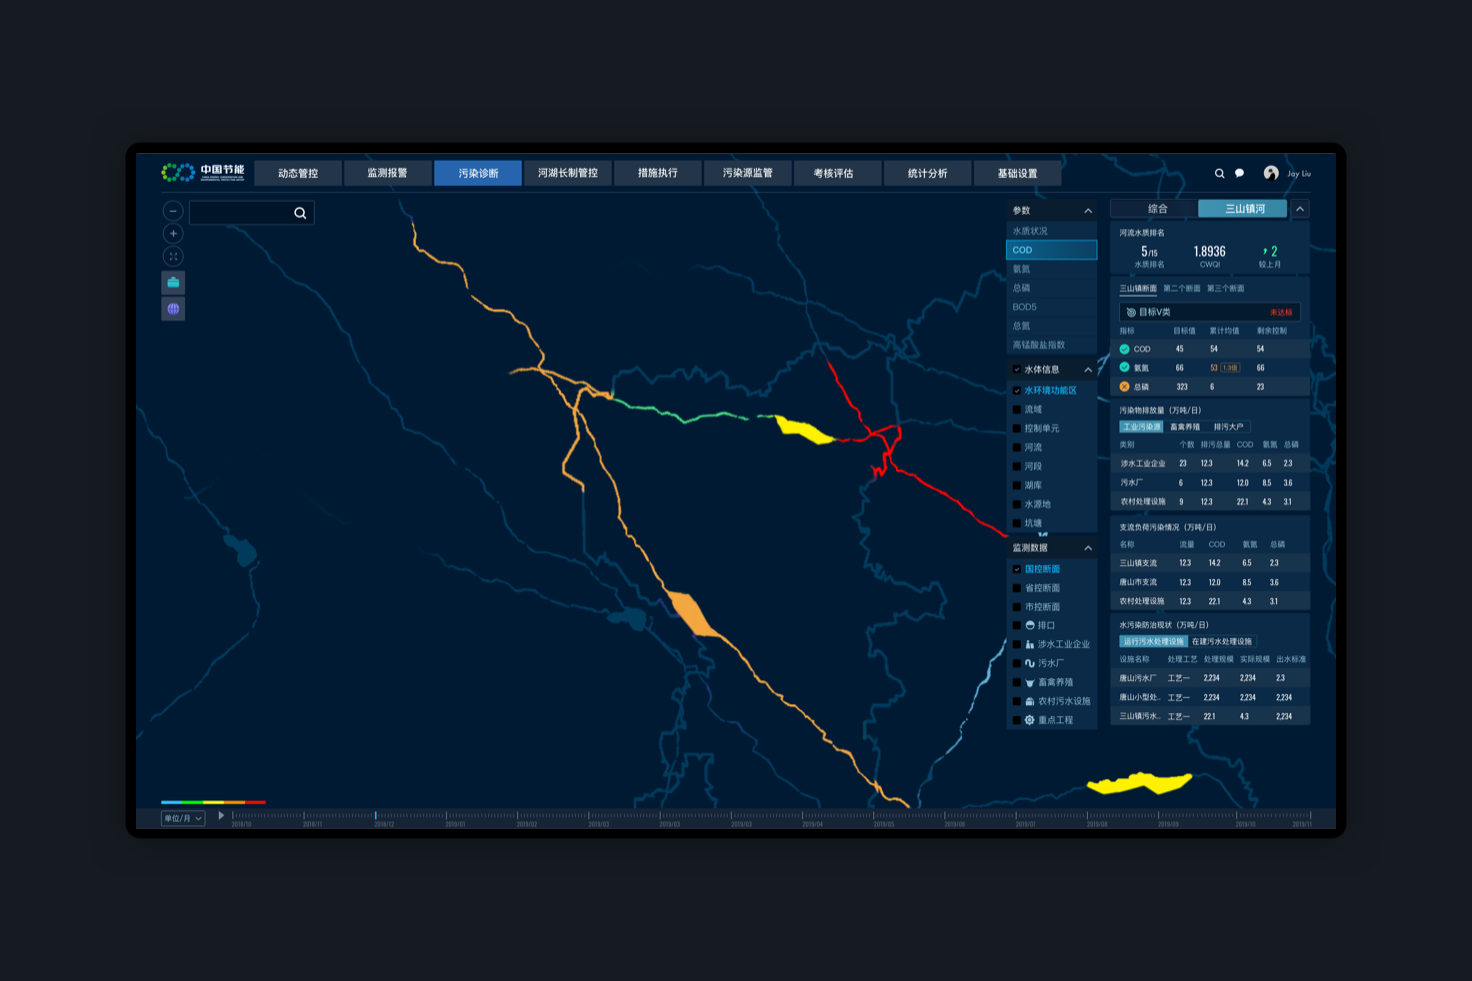
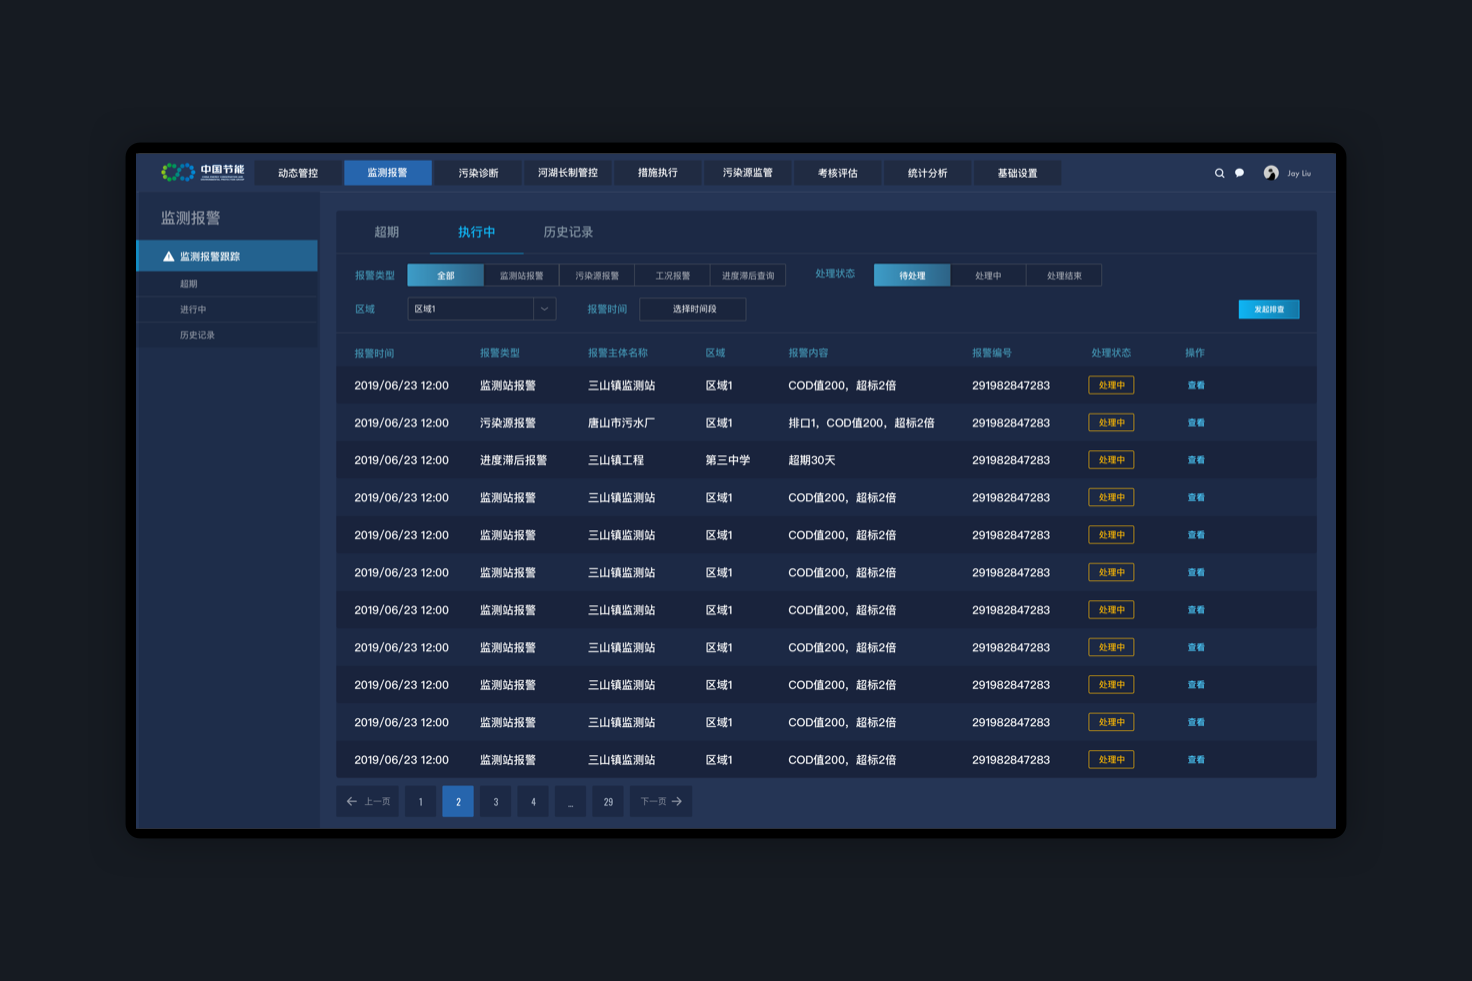
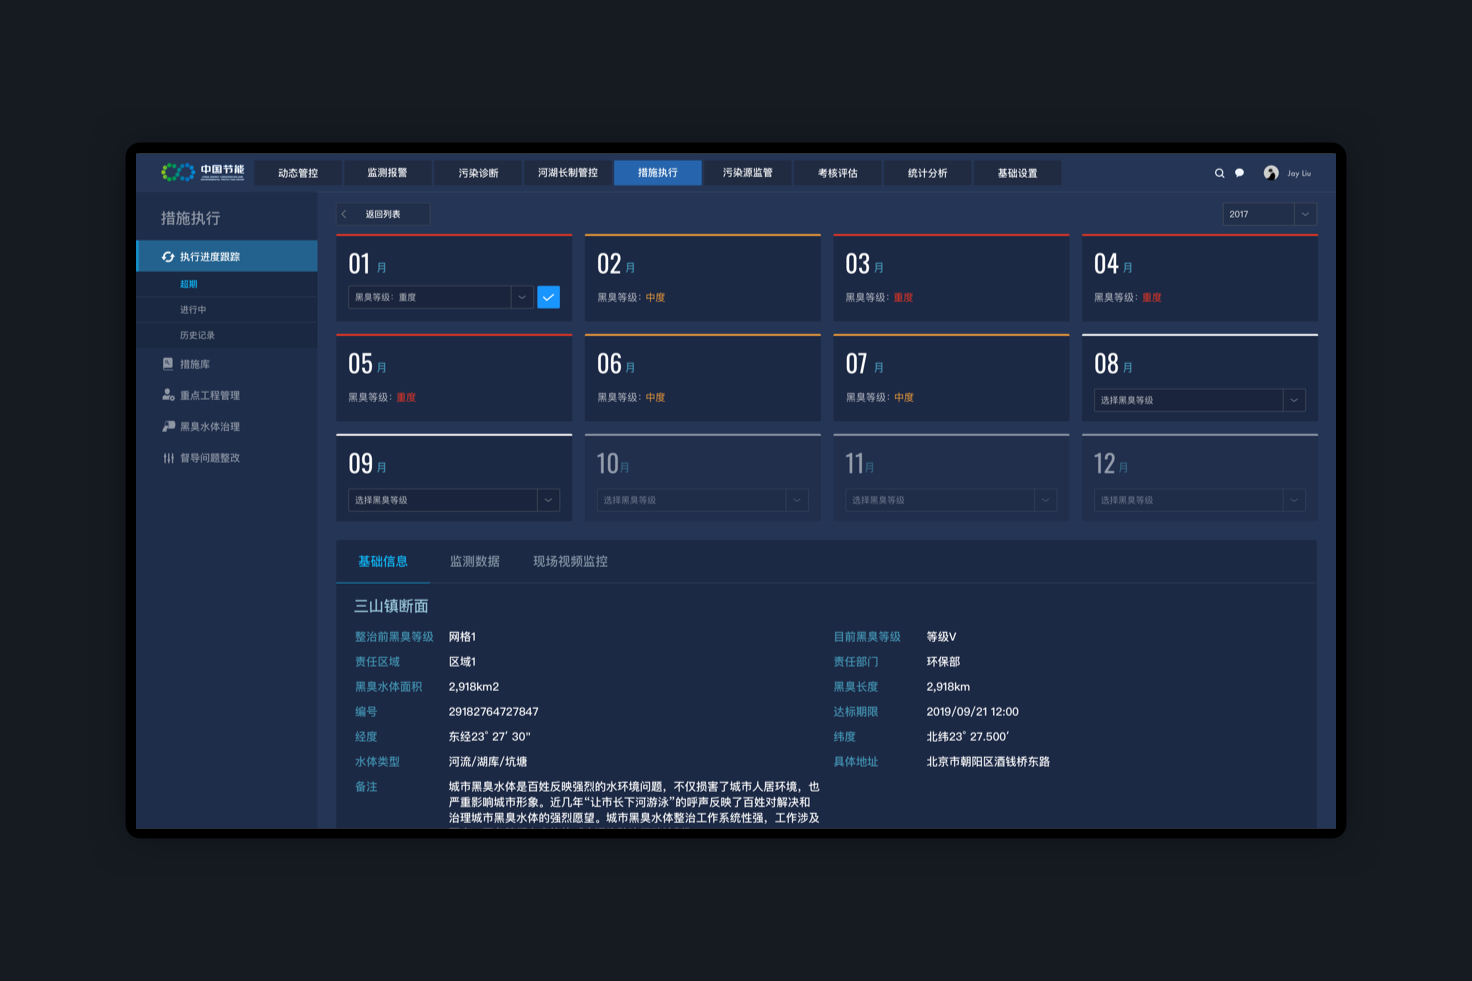
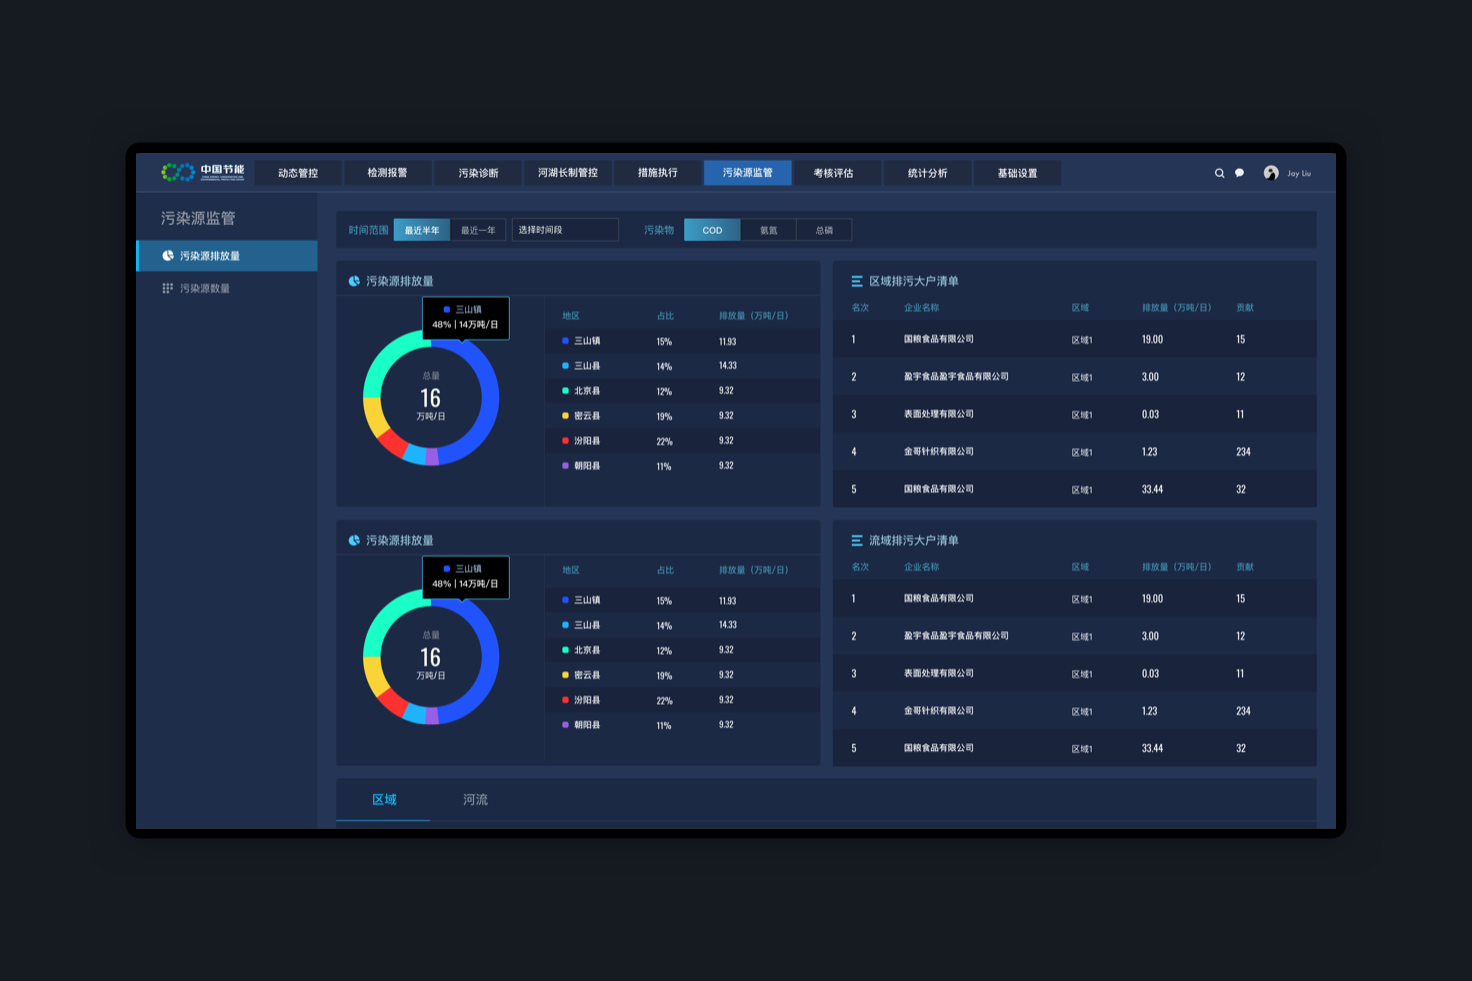
## English Content

### Introduction

"Pollution Assessment System Design" is a set of data visualization of GIS background system we designed for China Energy Conservation And Environmental Protection Group.
The main function is for the search of the main pollution area of each administrative area for each area of the atmosphere and water related information data and the back. Through the analysis of the information display and intuitive, find sources of pollution, for government workers work is to provide reliable and intuitive map information data.
This system is designed for real-time monitoring and alarming  a variety of pollution sources, monitoring stations, and pollution enterprises. It promotes pollution rectification by initiating control and inspection, and supervise the corrective measures and results.
This system establishes the comprehensive management and tracking of each pollution area, and long-term anti-pollution inspection mechanism, and solves the problem of repeated and difficult treatment.

![](https://static.glabcms.stoyard.com/object/20200418/jrv3kep1f7q.png)

![](https://static.glabcms.stoyard.com/object/20200417/1nuilkerpfr.png)

![](https://static.glabcms.stoyard.com/object/20200417/q504soyzrn.png)

![](https://static.glabcms.stoyard.com/object/20200417/wudvthit57k.png)

![](https://static.glabcms.stoyard.com/object/20200417/pac38sx1iq.png)

![](https://static.glabcms.stoyard.com/object/20200416/nb0ve1f6jcc.png)

![](https://static.glabcms.stoyard.com/object/20200416/cqvto4urhe7.png)

![](https://static.glabcms.stoyard.com/object/20200416/wohgx4opbeg.png)

![](https://static.glabcms.stoyard.com/object/20200416/y4jvnrc1lke.png)

![](https://static.glabcms.stoyard.com/object/20200416/7w8tbdl98bt.png)

Data visualization interface design difficulty lies in how the information in a wide range of complex and typesetting, layout, and the combination of graph information brings more concise and straightforward.In design we use a lot of auxiliary understand icon, the color of the combined pollution system, for a number of different status notifications using warm and cool colors are identified (whether completed/on, whether to exceed bid, and a series of state information).

![](https://static.glabcms.stoyard.com/object/20200417/xegy61mb9nq.png)

![](https://static.glabcms.stoyard.com/object/20200417/kthsf2f18y.png)

![](https://static.glabcms.stoyard.com/object/20200417/grg4osikuyi.png)

![](https://static.glabcms.stoyard.com/object/20200417/5sveu7n17do.png)

![](https://static.glabcms.stoyard.com/object/20200417/6dmbudbyu7k.png)

![](https://static.glabcms.stoyard.com/object/20200417/ay26wvoegsa.png)

![](https://static.glabcms.stoyard.com/object/20200418/mwcijrjtt5b.png)

![](https://static.glabcms.stoyard.com/object/20200418/mppnjixybc.png)

![](https://static.glabcms.stoyard.com/object/20200418/5vf5h18aqvu.png)

![](https://static.glabcms.stoyard.com/object/20200418/lqi1f2qkgli.png)

![](https://static.glabcms.stoyard.com/object/20200417/xnpk6a1akgg.png)

![](https://static.glabcms.stoyard.com/object/20200417/v7bnzjel9j.png)

![](https://static.glabcms.stoyard.com/object/20200417/c3e4axstsnj.png)

![](https://static.glabcms.stoyard.com/object/20200417/h28baag68y.png)

![](https://static.glabcms.stoyard.com/object/20200417/im7qqea2d4i.png)

![](https://static.glabcms.stoyard.com/object/20200418/37zse04dj7y.png)

![](https://static.glabcms.stoyard.com/object/20200418/v9t1ldmpao.png)

![](https://static.glabcms.stoyard.com/object/20200418/2ukopiihb75.png)

![](https://static.glabcms.stoyard.com/object/20200418/bwsv45uo5tm.png)