# 交互响应:性能预算之外的另一项必要投入 - ID: 98 - URL: https://www.stoyard.com/viewpoint/98 - English URL: https://www.stoyard.com/en/viewpoint/98 - Category: 技术分享 - English Category: Technical Sharing - English Title: Interactive response: another necessary input beyond the performance budget ## 中文主体 > CrUX 2026 年 8 月数据里,三项核心指标全过的源只有 55.6%,唯一逐月变差的是交互响应。加载有性能预算,交互响应还需要并列的一笔额度。 技术分享 / 网站性能 ## 在 1,829 万个有真实用户数据的网站源里,三项核心网页指标全部达标的只有 55.6%;而三项里唯一在逐月变差的,是交互响应。 这组数字来自 Chrome UX Report(CrUX)2026 年 8 月数据集,覆盖 18,294,881 个源,由 Chrome 采集真实用户在真实设备上的体验数据,不是实验室跑分。它只统计有足够真实流量的源,不代表全部网站;2026 年 5 月的移动端与桌面端分组数据,来自第三方基于 CrUX 的二次分析,样本 13.75M 个源。下面用它看结构趋势,不用来给单个网站下结论。 ## 加载有预算,交互响应常被省略 过去十年,网站性能预算基本围绕加载展开:资源体积、请求数量、图片与脚本压缩、首屏绘制时间。这套做法有明确的指标对应——LCP(最大内容绘制),也有成熟的压缩与裁剪手段。 交互响应长期不在预算表里。一个页面能不能点、输入跟不跟手、展开和提交要不要等,通常被当作「开发完成后再调」的体验问题,而不是上线前就要分配额度的约束。 页面交互的数量这些年也在变多:单页应用、动态筛选、即时输入反馈、表单分步提交,都把响应压力压在交互这一侧。加载慢,用户通常还能等;**交互不跟手,用户会直接判断这个页面不好用。** ## 交互预算:和加载预算并列的一笔额度 我们把这笔额度称为交互预算:为页面上的高频交互预留的响应时间额度,与加载性能预算并列。它的衡量指标是 INP(Interaction to Next Paint,交互到下次绘制),覆盖点击、输入、展开、提交等全部交互,而不只是某一次点击。 边界也要说清:交互预算只管交互响应,不含资源体积与加载速度;它不替代加载预算,是在加载预算之外并列的另一项。 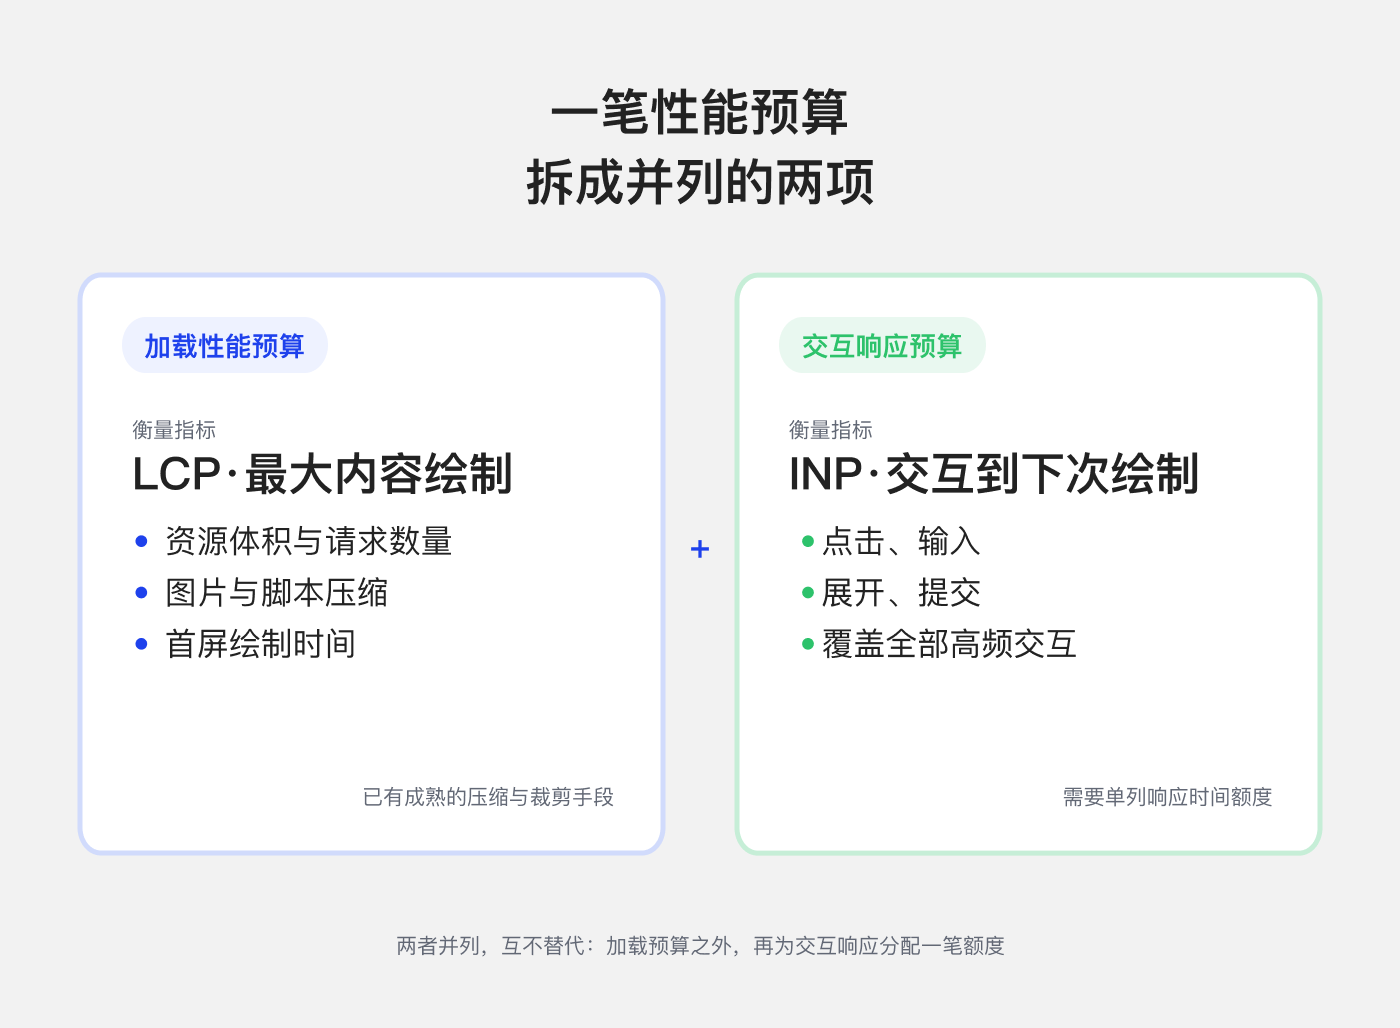 加载预算与交互预算并列示意 ## 三组数字说明的现状 第一组是 2026 年 8 月 CrUX 数据集,18,294,881 个源:LCP 良好 68.1%,CLS 81.5%,INP 85.3%,三项全过 55.6%。INP 自 2026 年 3 月起逐月下滑,Chrome 团队在版本说明中表示,目前尚无确定原因。 第二组是年度对比:2025 年 8 月到 2026 年 8 月,LCP 从 66.7% 升到 68.1%,CLS 从 80.1% 升到 81.5%,INP 从 85.7% 降到 85.3%,三项全过从 53.5% 升到 55.6%。**加载类指标在改善,交互类指标在回落。** 第三组是设备分组,2026 年 5 月数据集、13.75M 个源:移动端三项全过 49.1%,桌面端 58.0%,相差 9 个百分点。移动端的交互场景更多,输入、滑动、展开都在这一侧,响应压力也更大。 按 Google 的指标阈值,INP 在 200 毫秒以内为良好,200 至 500 毫秒为需要改进,超过 500 毫秒为较差。这个阈值就是交互预算可以对照的刻度。 三组数字合起来的含义是:加载侧的优化已经接近常规动作,交互侧的表现却在回落,而它恰恰是用户最直接感受到的部分。**指标的分化说明问题不在整体性能,而在交互这一项没有被单独管理。** ## 怎么定一笔交互预算 - **列出高频交互:**这个页面上用户最常做的三到五个动作,比如点击、输入、筛选、展开、提交,先覆盖它们。 - **按阈值分配额度:**以 200 毫秒为良好线,给每个高频动作预留响应时间。额度不是拍一个数字,而是先在真实设备上量出当前响应,再把高频动作排在前面优化。 - **真实设备验证:**在目标用户实际使用的机型和网络条件下测,不以实验室高配设备为准。 - **季度复测:**和加载指标一起纳入例行复核,看 INP 是改善还是回落。 ## 边界与复核清单 交互预算解决的是响应速度,不解决功能是否好用、信息是否清楚;它也不替代可用性与可访问性检查。 容易混淆的地方,是把交互问题归到视觉或开发排期里。交互响应和界面长什么样是两件事:前者取决于脚本执行与主线程占用,后者是样式与布局;混在一起,问题通常要到上线后才暴露。 上线前可以自问四句:高频动作列出来了吗?每个动作有响应时间额度吗?在真实设备上测过吗?上一次复测是什么时候? STOYARD Insight** ### 在 Define 阶段把交互响应和加载性能一起写进体验约束,Build 阶段在真实设备上验证高频动作的响应,Evolve 阶段按季度复测核心指标。并且持续关注数据变化情况。 **关键词**: 交互性能、INP、Core Web Vitals、性能预算、用户体验、网站性能 **分类**: 技术分享 / 网站性能 / 用户体验 **资料来源**: [1] Chrome for Developers,《Chrome UX Report 版本说明》,2026-11-11 更新(2026 年 8 月数据集)。[developer.chrome.google.cn/docs/crux/release-notes?hl=zh-cn](https://developer.chrome.google.cn/docs/crux/release-notes?hl=zh-cn) [2] CoreWebVitals.io,《Core Web Vitals: LCP, INP & CLS Explained (2026)》,2026-11-04。[corewebvitals.io/core-web-vitals](https://www.corewebvitals.io/core-web-vitals) [3] PageSpeed Matters,《Core Web Vitals Pass Rate 2026: 49.1% of 13.75M Sites》,2026-06-12(CrUX 2026 年 5 月数据集)。[pagespeedmatters.com/resources/data-studies/core-web-vitals-pass-rates](https://www.pagespeedmatters.com/resources/data-studies/core-web-vitals-pass-rates) ## English Content > In the CrUX August 2026 data, only 55.6 percent of the sources passed all three core indicators, and the only month-to-month deterioration was the interactive response. Loaded with a performance budget, interactive response also requires a parallel quota. Technical Sharing/Website Performance ## Of the 18.29 million website sources with real user data, only 55.6 per cent of the three core web indicators met the standard. The only one of the three items that is getting worse month by month isInteractive Response。 ### This set of numbers comes from the Chrome UX Report(CrUX) August 2026 data set, covering 18,294,881 sources. Chrome collects experience data of real users on real devices, not laboratory runs. It only counts sources with enough real traffic and does not represent all websites. The mobile and desktop grouping data in May 2026 came from a third-party CrUX-based secondary analysis with a sample of 13.75M sources. Use it below to look at structural trends, not to draw conclusions for individual sites. ## loaded with budget, interactive responses are often omitted Over the past decade, website performance budgets have largely revolved around loading: resource volume, number of requests, image and script compression, and first-screen drawing time. This approach has a clear indicator correspondence-LCP (Maximum Content Drawing), as well as mature compression and clipping methods. Interactive response is not in the budget table for a long time. Whether a page can be ordered, entered or not followed, expanded and submitted is usually regarded as an experience problem of "adjusting after development", rather than a constraint of allocating quota before going online. The number of page interactions has also increased over the years: single-page applications, dynamic filtering, instant input feedback, and step-by-step form submission all put the response pressure on the interaction side. Loading is slow, the user can usually wait;**If the interaction does not follow hands, the user will directly judge that this page is not useful.** ## Interactive budget: a quota juxtaposed with the loaded budget We call this amount the interaction budget: the amount of response time reserved for high-frequency interactions on the page, alongside the load performance budget. Its measurement indicator is INP(Interaction to Next Paint, interaction to next drawing), which covers all interactions such as click, input, expansion, submission, etc., not just one click. The boundary should also be clear: the interactive budget is only interactive response and does not include resource volume and load speed. Load Budget and Interactive Budget Side by Side ## Three sets of figures illustrate the current situation The first group is the August 2026 crUX data set, with 18,294,881 sources: LCP good 68.1%,CLS 81.5%,INP 85.3%, and all three items over 55.6%. INP has declined month-on-month since March 2026, and the Chrome team said in a release note that it has not yet determined why. The second group is an annual comparison: from August 2025 to August 2026, LCP rose from 66.7 per cent to 68.1 per cent, CLS from 80.1 per cent to 81.5 per cent, INP from 85.7 per cent to 85.3 per cent, and all three items rose from 53.5 per cent to 55.6 per cent.**The loading class indicator is improving and the interaction class indicator is falling back.** The third group is equipment grouping. In May 2026, the data set and 13.75M sources were all over 49.1 on the mobile side and 58.0 on the desktop side, a difference of 9 percentage points. There are more interactive scenes on the mobile side, with input, sliding and unfolding on this side, and the response pressure is also greater. According to Google's indicator threshold, INP is good within 200 milliseconds, needs improvement 200 to 500 milliseconds, and is poor over 500 milliseconds. This threshold is the scale on which the interaction budget can be compared. The combination of the three sets of numbers means that the optimization on the loading side is close to the regular action, while the performance on the interaction side is falling back, and it is precisely the part that the user feels most directly.**The differentiation of indicators indicates that the problem is not in overall performance, but in interaction, which is not managed separately.** ## How to set an interactive budget - **List high frequency interactions:**The three to five most common actions users do on this page, such as click, enter, filter, expand, submit, override them first. - **Allocate quota by threshold:**With 200 milliseconds as a good line, a response time is reserved for each high-frequency action. The quota is not to take a number, but to measure the current response on the real device first, and then optimize the high-frequency action in front. - **Real Device Verification:**The model and network conditions actually used by the target user shall not be subject to the high equipment in the laboratory. - **Quarterly retest:**Include in a routine review with the loading indicator to see if the INP is improving or falling back. ## Boundary and Review Checklist The interactive budget addresses the speed of response and does not address whether the function is easy to use or whether the information is clear; nor does it replace usability and accessibility checks. What is easy to confuse is to attribute interaction issues to visual or development scheduling. Interactive response and what the interface looks like are two things: the former depends on script execution and the main thread occupation, and the latter is style and layout. before going online, you can ask yourself four sentences: are the high-frequency actions listed? is there a response time limit for each action? have you tested it on a real device? when was the last retest? ### The STOYARD writes the interaction response and loading performance together into the experience constraints in the Define phase, the Build phase verifies the response of high-frequency actions on real devices, and the Evolve phase retests the core metrics on a quarterly basis. **Keywords**: Interactive Performance, INP, Core Web Vitals, Performance Budget, User Experience, Site Performance **Category**: Technology Sharing/Website Performance/User Experience **Source of Information**: [1] Chrome for Developers, Chrome UX Report Release Notes, Update 2026-11-11 (August 2026 data set).[developer.chrome.google.cn/docs/crux/ release-notes?hl = zh-cn](https://developer.chrome.google.cn/docs/crux/release-notes?hl=zh-cn) [2] CoreWebVitals.io,《Core Web Vitals: LCP,INP & CLS解释 (2026)》,2026。[corewebvitals.io/core-web-vitals](https://www.corewebvitals.io/core-web-vitals) [3] PageSpeed Matters, Core Web Vitals Pass Rate 2026: 49.1% of 13.75M Sites, 2026-06-12(CrUX May 2026 data set).[pagespeedmatters.com/resources/ 数据-研究/核心-web-生命-通过率](https://www.pagespeedmatters.com/resources/data-studies/core-web-vitals-pass-rates)